In this tutorial, you will learn how to use the Activities and Activity Hours tracking reports to effectively monitor the enrichment and employer engagement activities recorded for students.
Go to login.navigate.uk.com
1. Open Reports Module
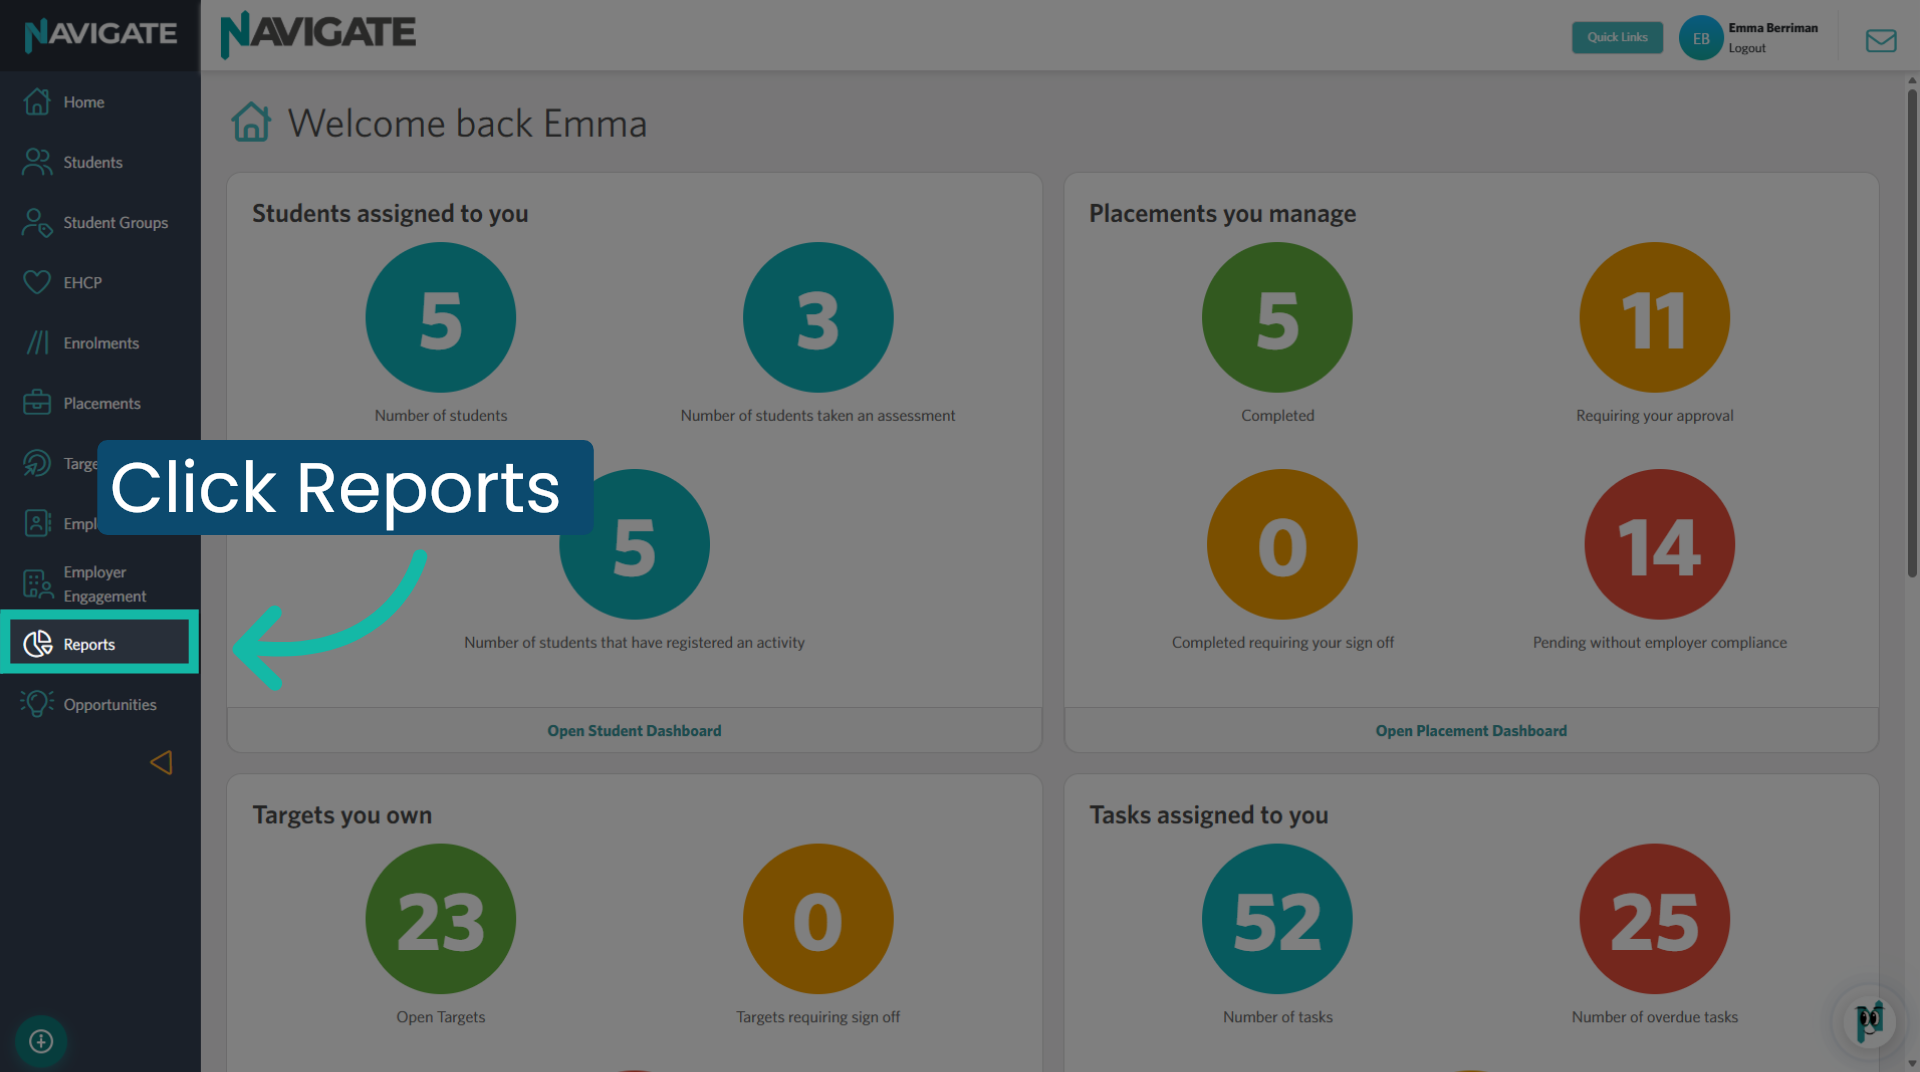
Once logged in, click the reports module to view the Power BI reports.
2. Activities Report
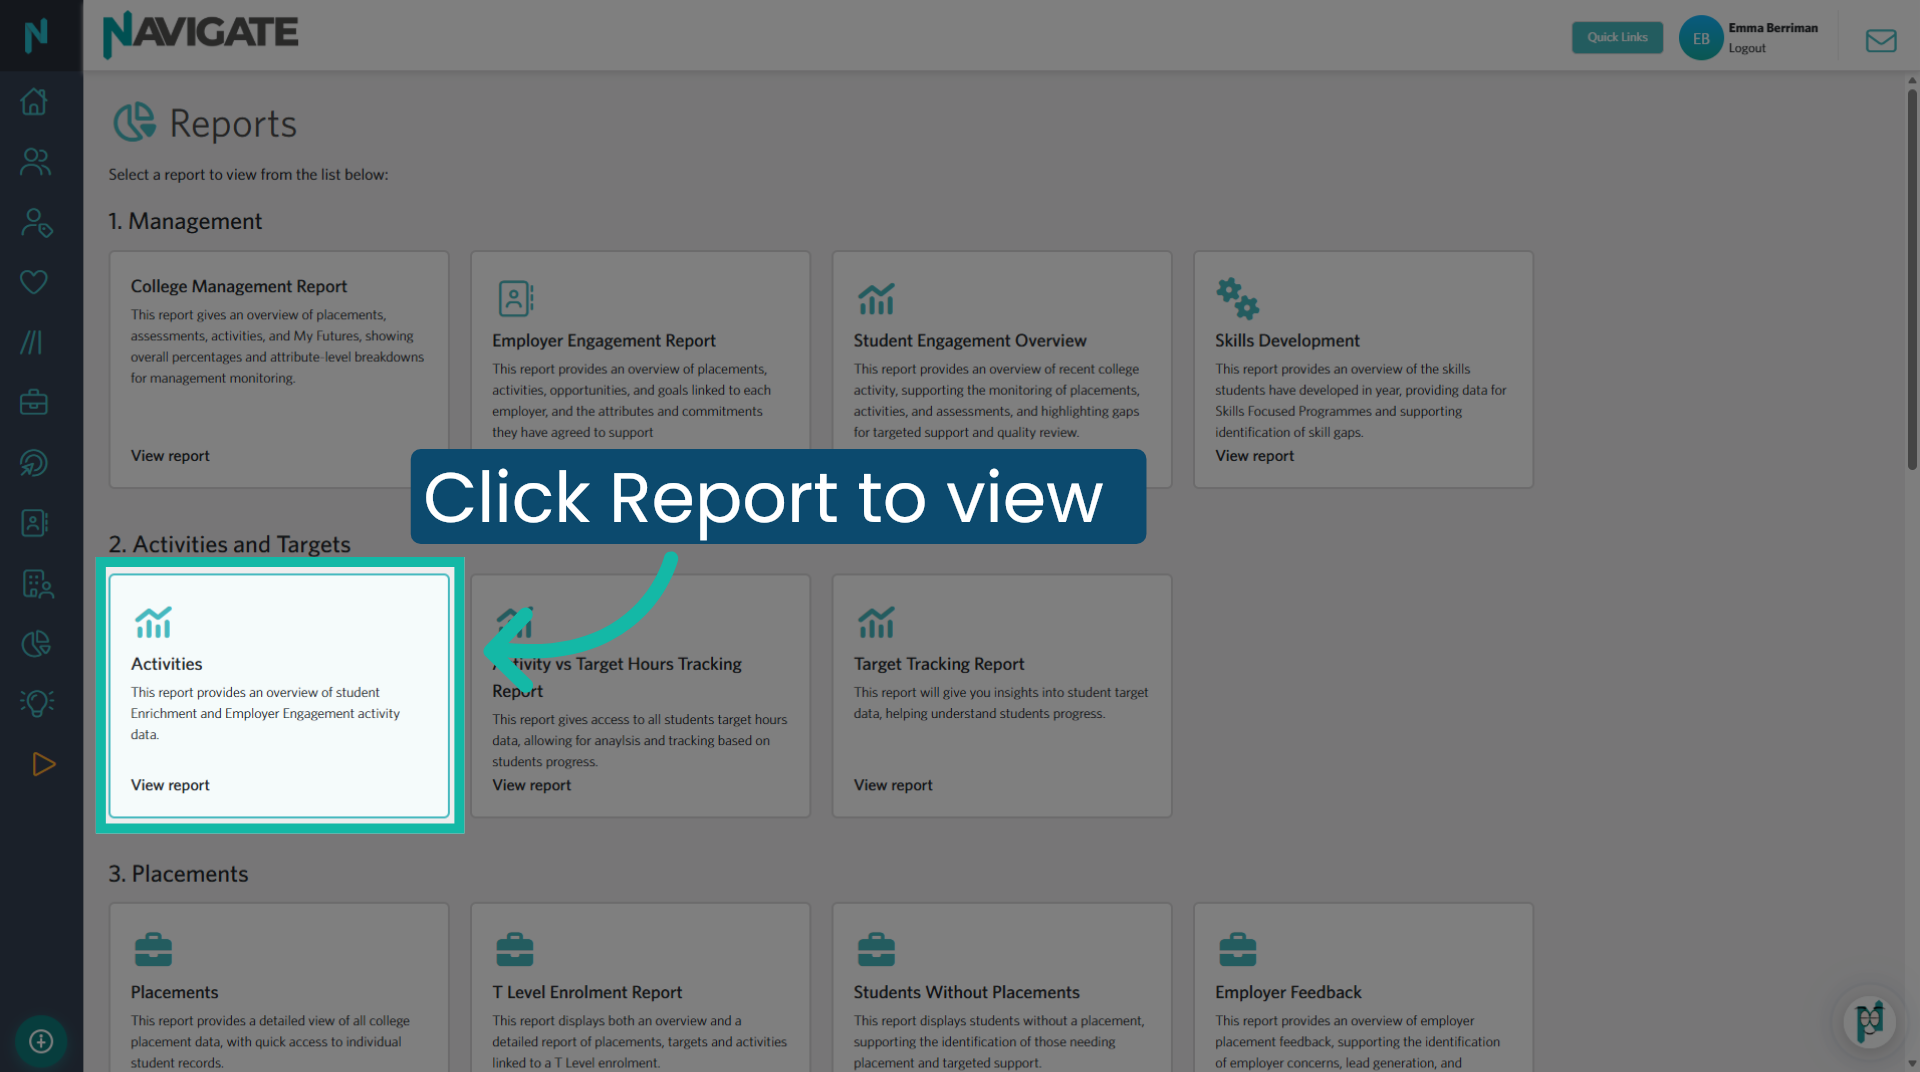
The activities report enables you to view the enrichment and employer engagement activities recorded for students. The attributes allow you to delve into your cohorts and select either enrichment, employer engagement, or both.
3. More options
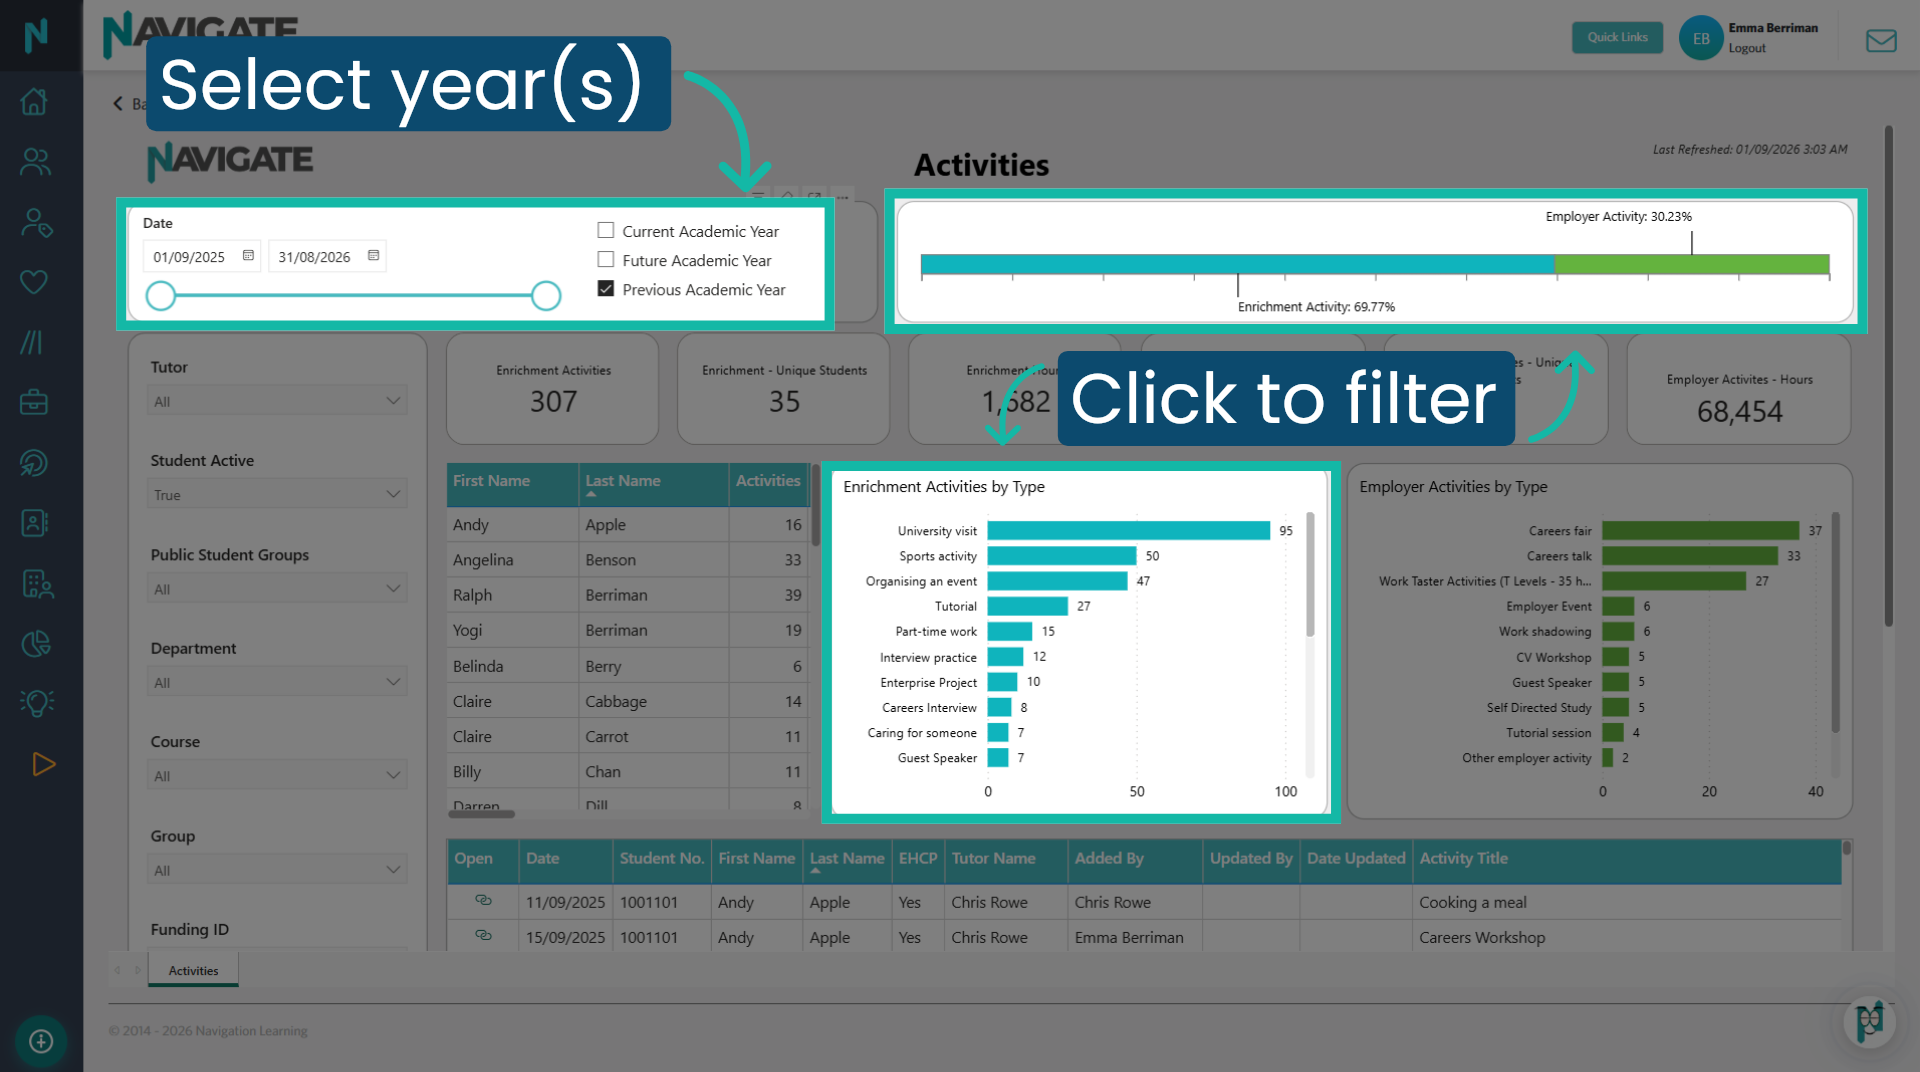
Select the year or years you wish to view data for, or utilise the calendar selector for a more precise date range. Click on any data bar to display specific activity type data in the grid.
4. Data grid
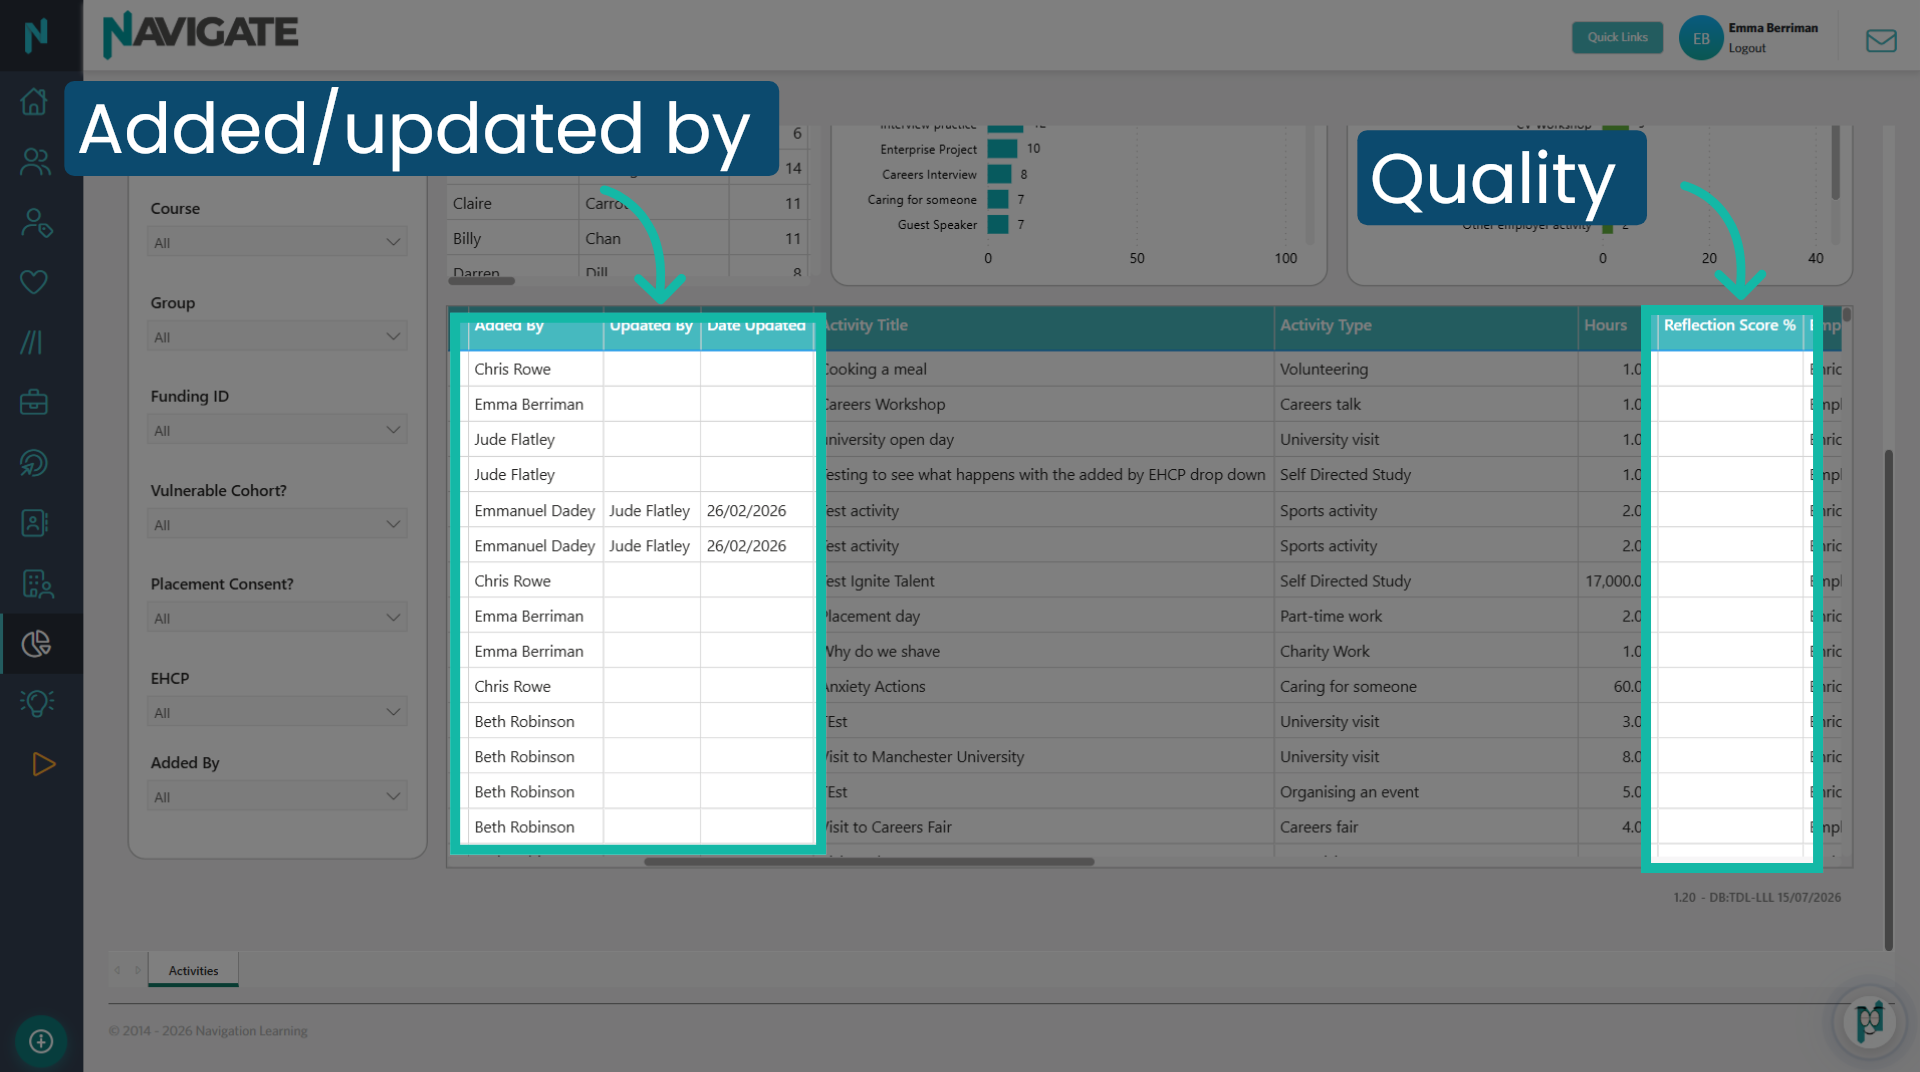
Regularly verify that students are reflecting on both their own activities and those added by staff. If the 'Added by' column indicates a staff member, the 'Updated by' column should show 'Student'. Review the reflection score to assess the quality.
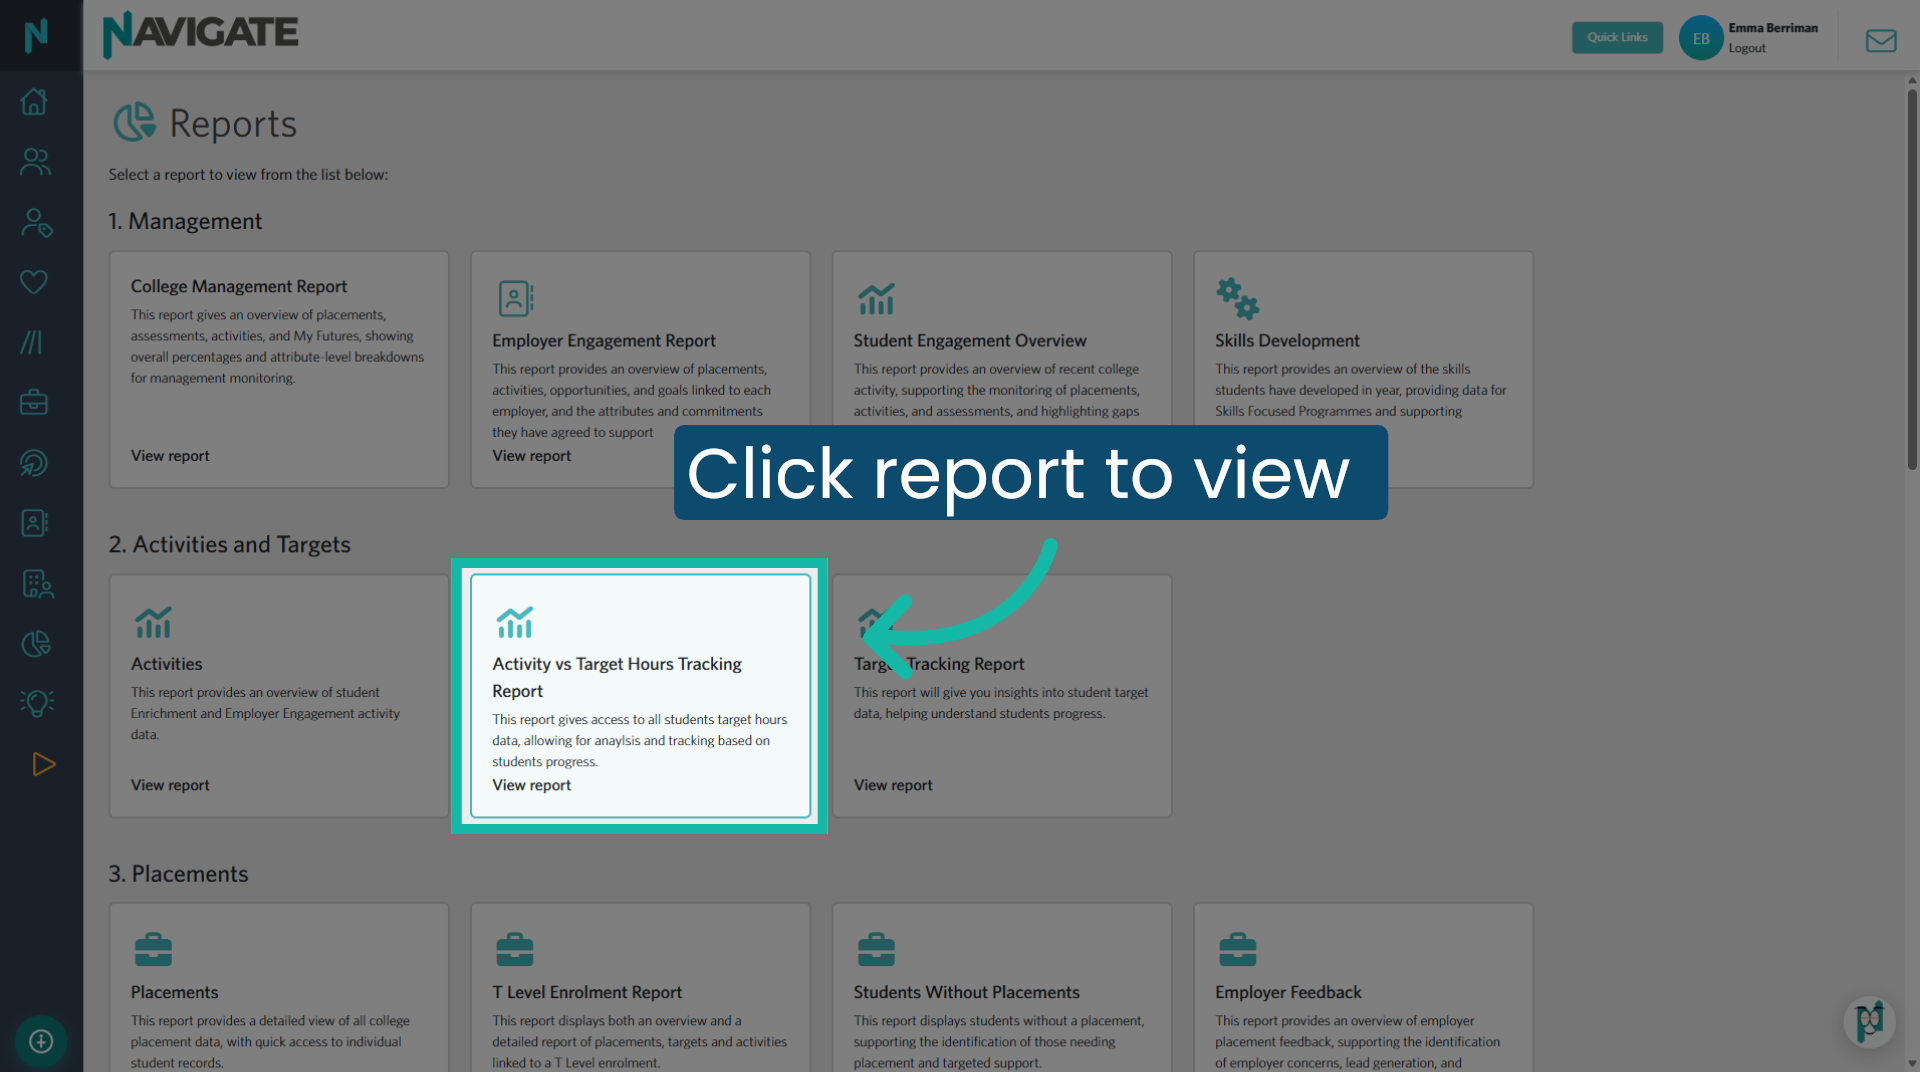
5. Activity vs Target Hours Tracking report
This report allows you to view progress towards activity target hours set for students.
6. Whole college overview
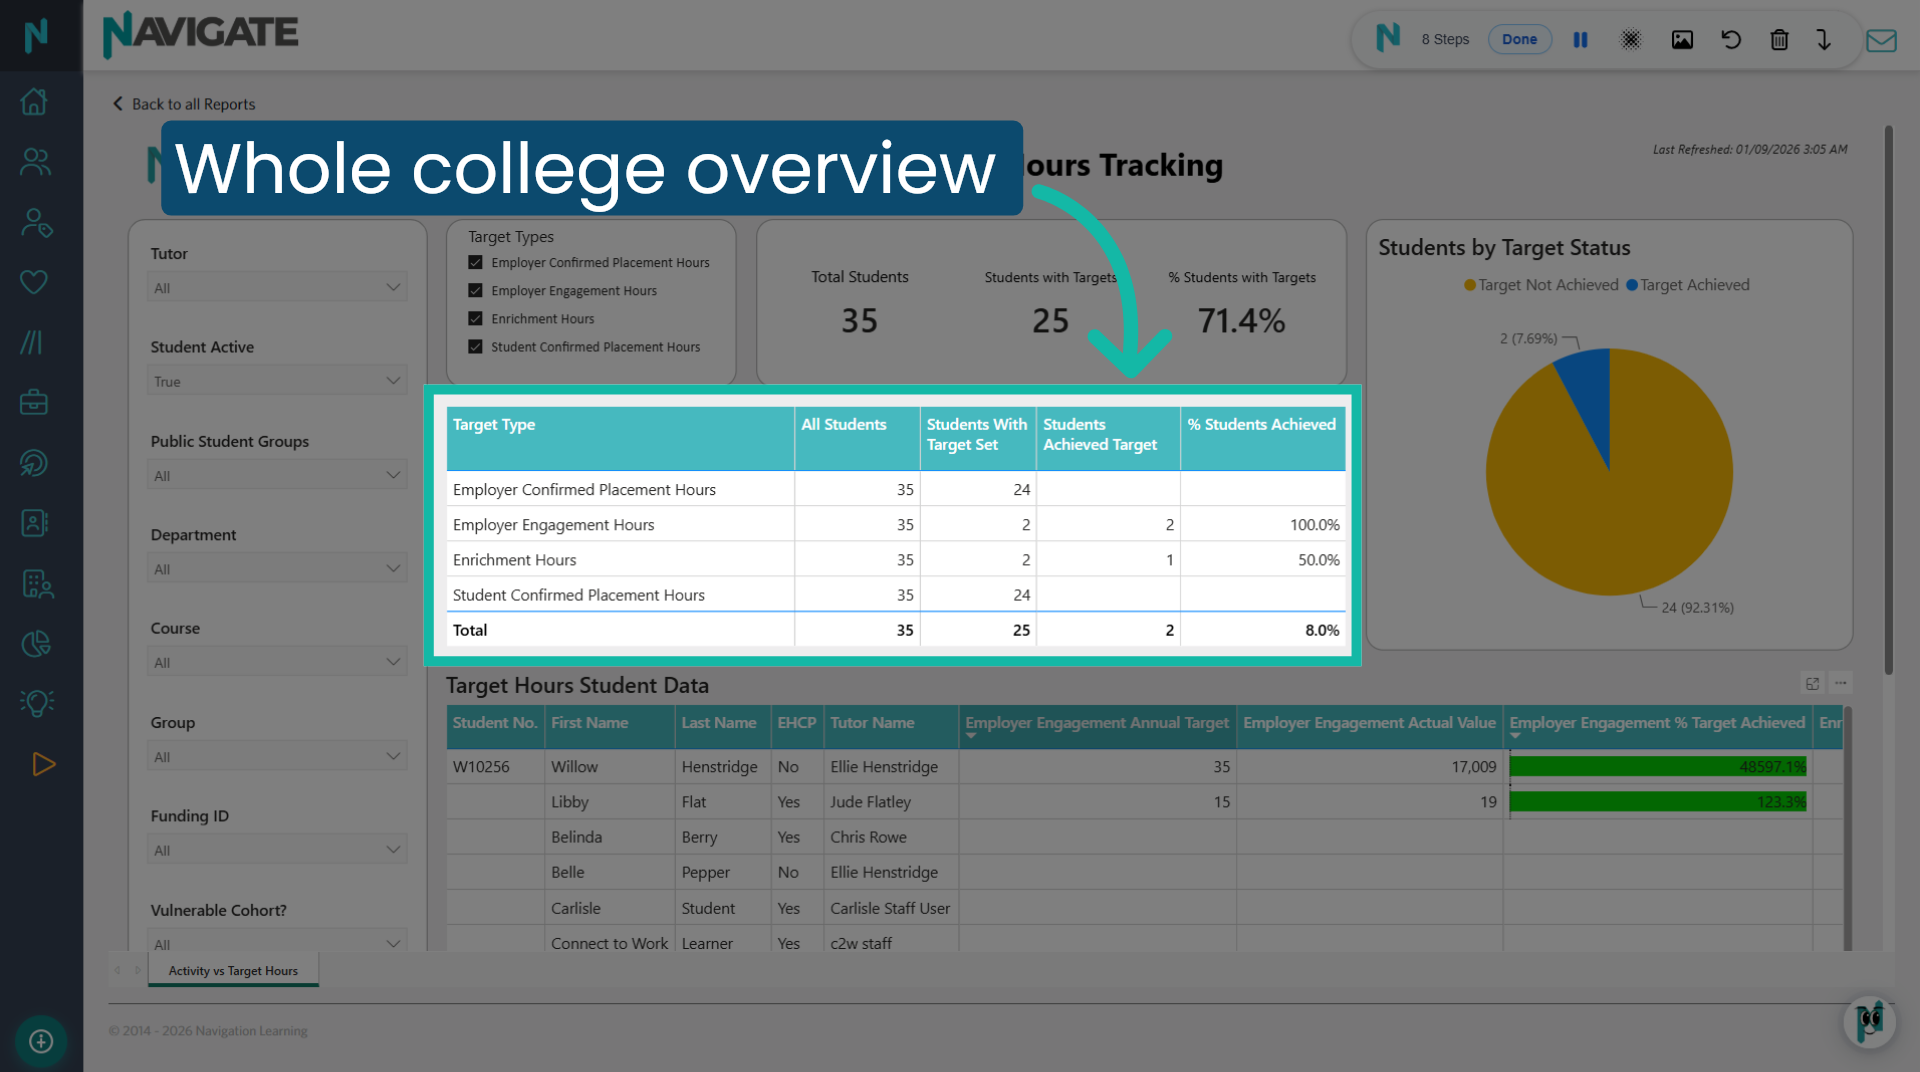
At the beginning of the year, if you have established and set 'Target Hours' for any employer engagement, enrichment, or placements for your cohorts, you will be able to view which ones have achieved these set targets using this report. The first grid provides an overview that can be filtered by target type.
7. Check for missing targets
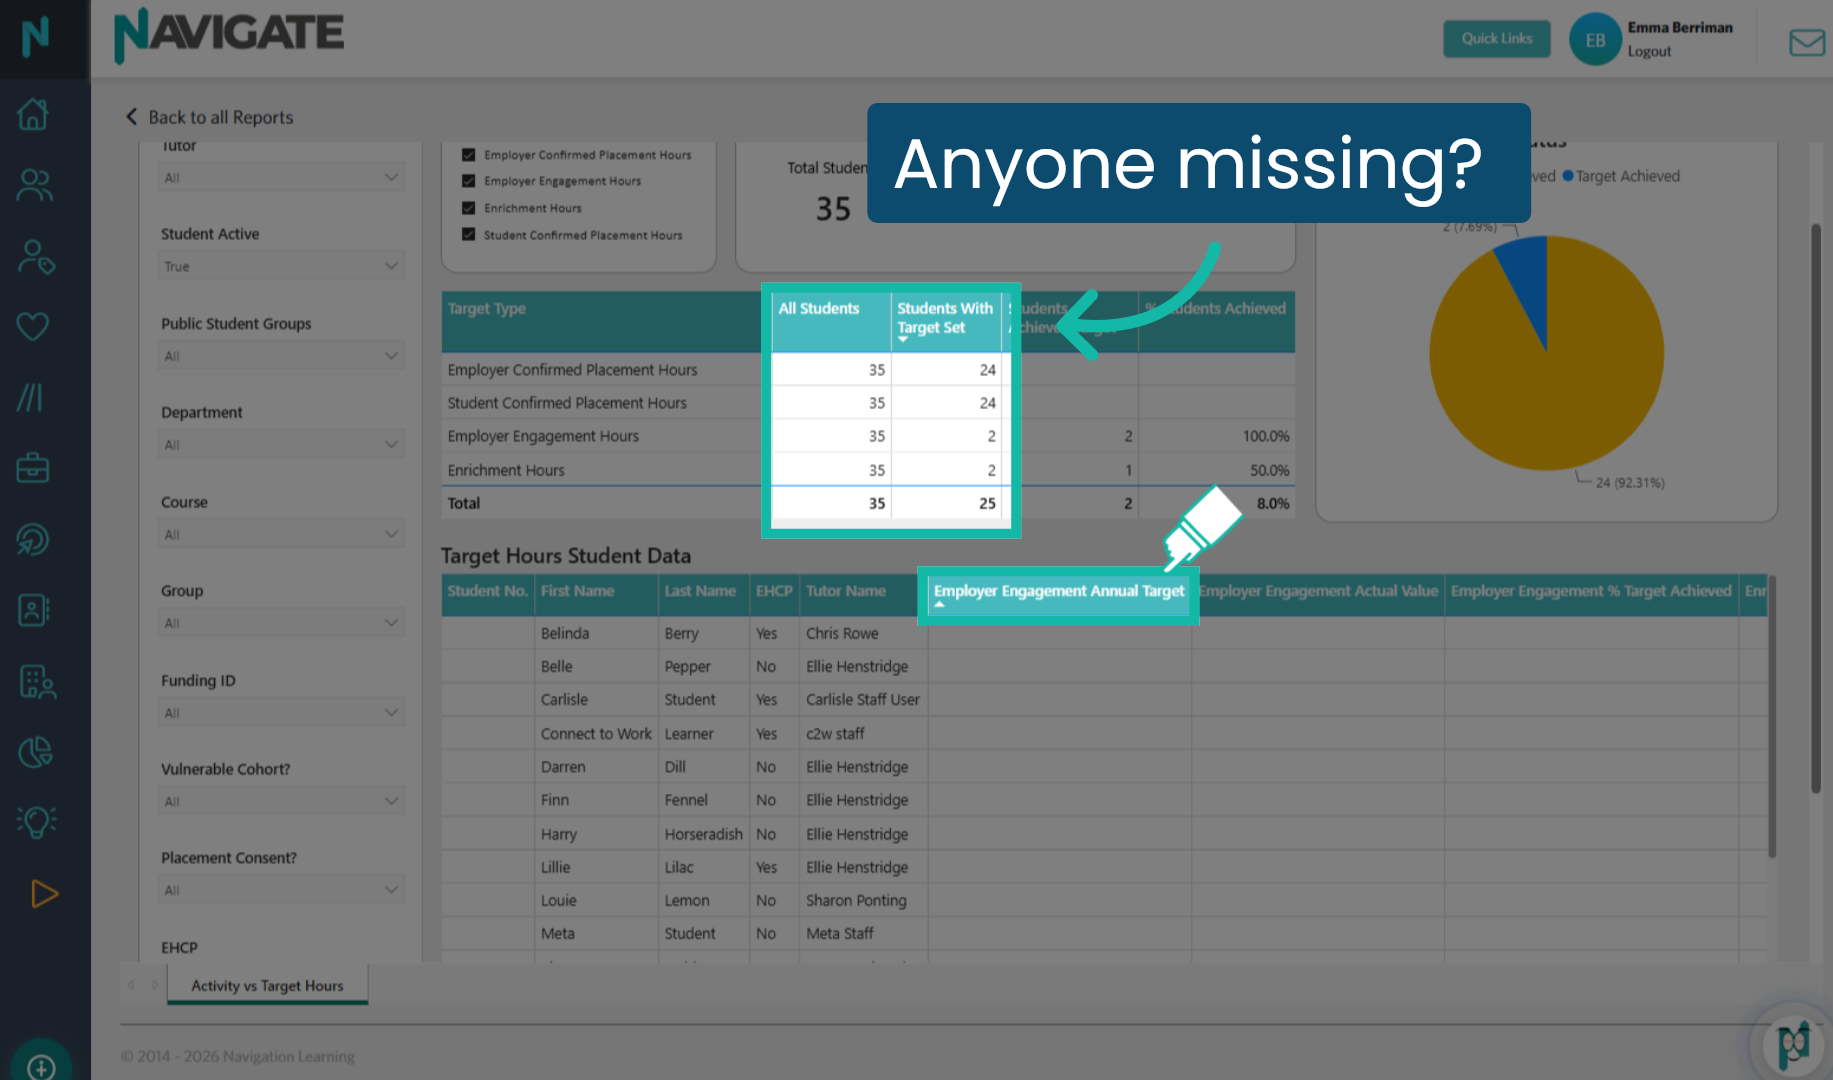
After filtering for a cohort using the attributes, you can determine if there are any students who have not yet had a target assigned by comparing the total number of 'All students' to the count of 'Students with a target set' across the four target types. To view the blanks, simply tap the 'Type' header in the Actual target column. Similar to all grids in the Navigate reports, there are additional options available for viewing the grid data, including a focus mode and the ability to download it as a spreadsheet.
Was this article helpful?
That’s Great!
Thank you for your feedback
Sorry! We couldn't be helpful
Thank you for your feedback
Feedback sent
We appreciate your effort and will try to fix the article