This tutorial guides you through the T Level Enrolment Report to help you analyse placement and enrolment data.
1. Access Reports Module
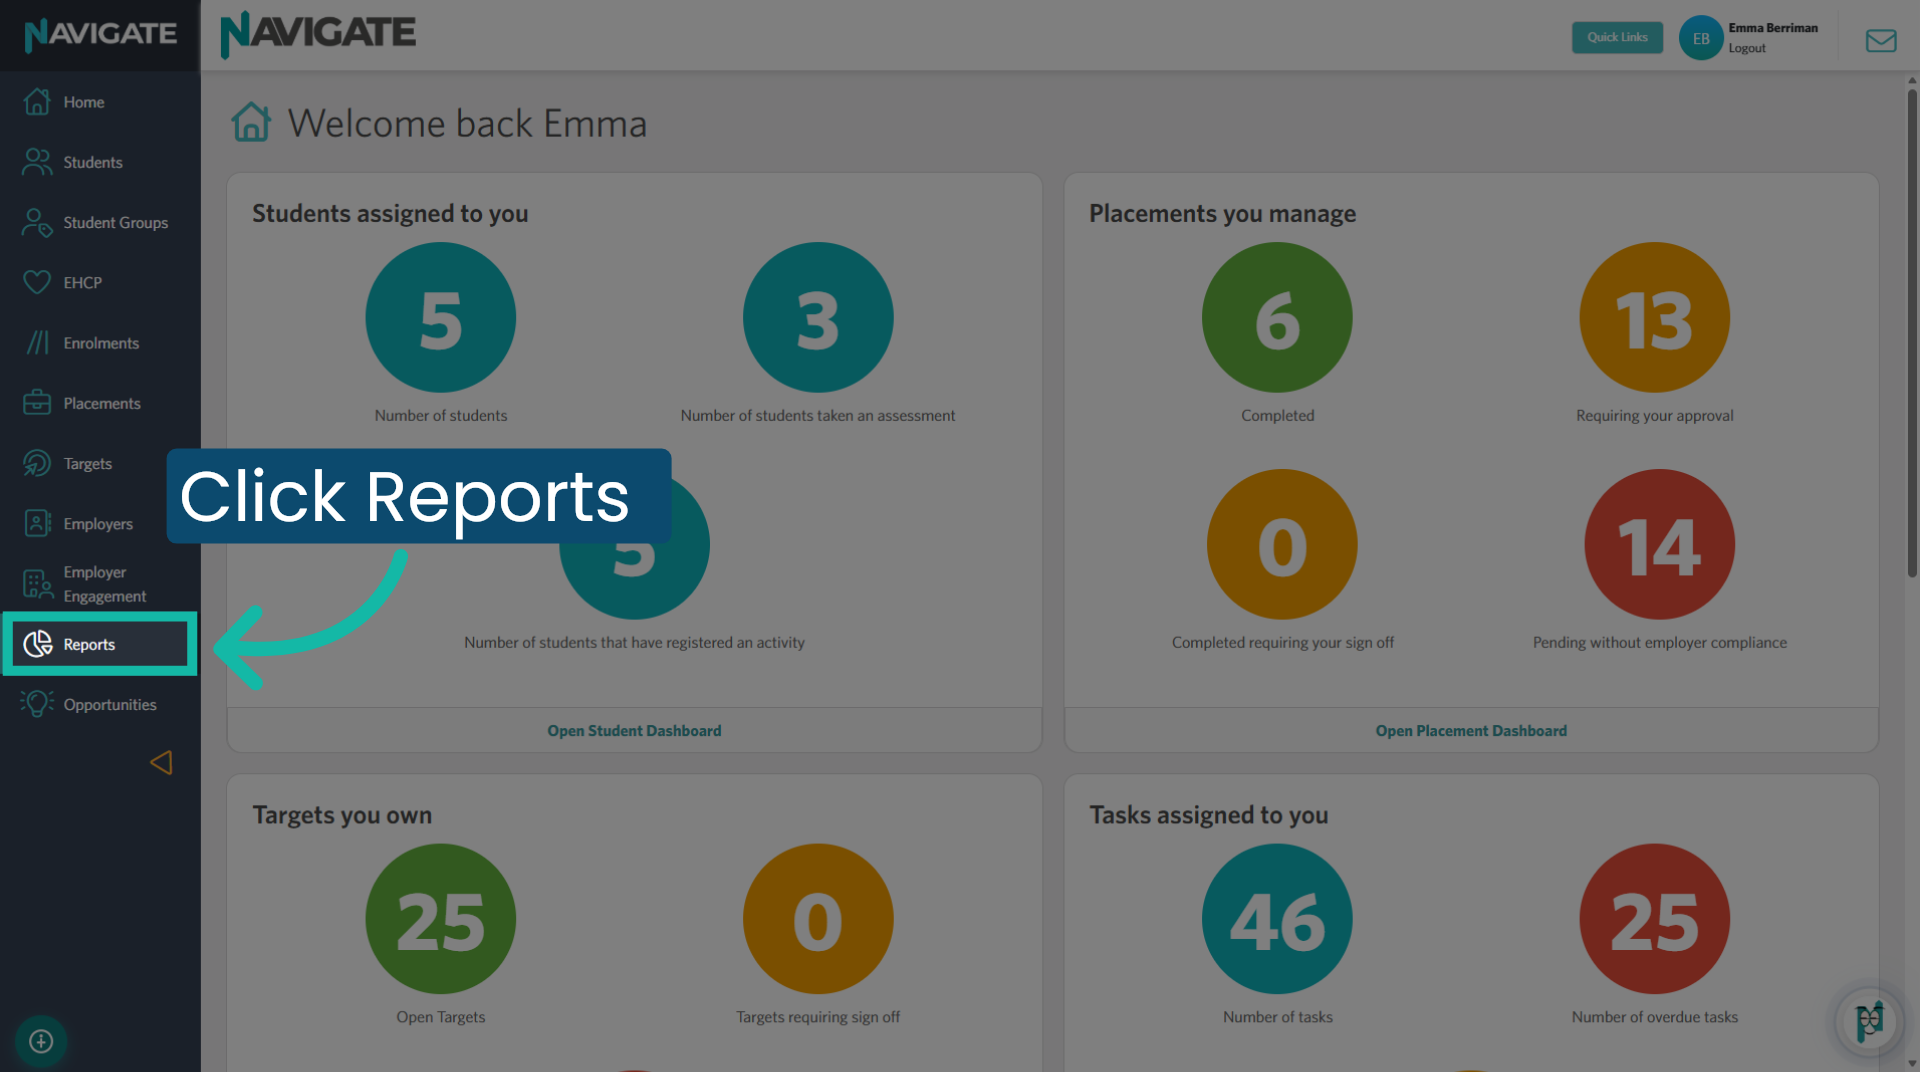
Click the Reports tab to access the reports module.
2. Open T Level Enrolment Report
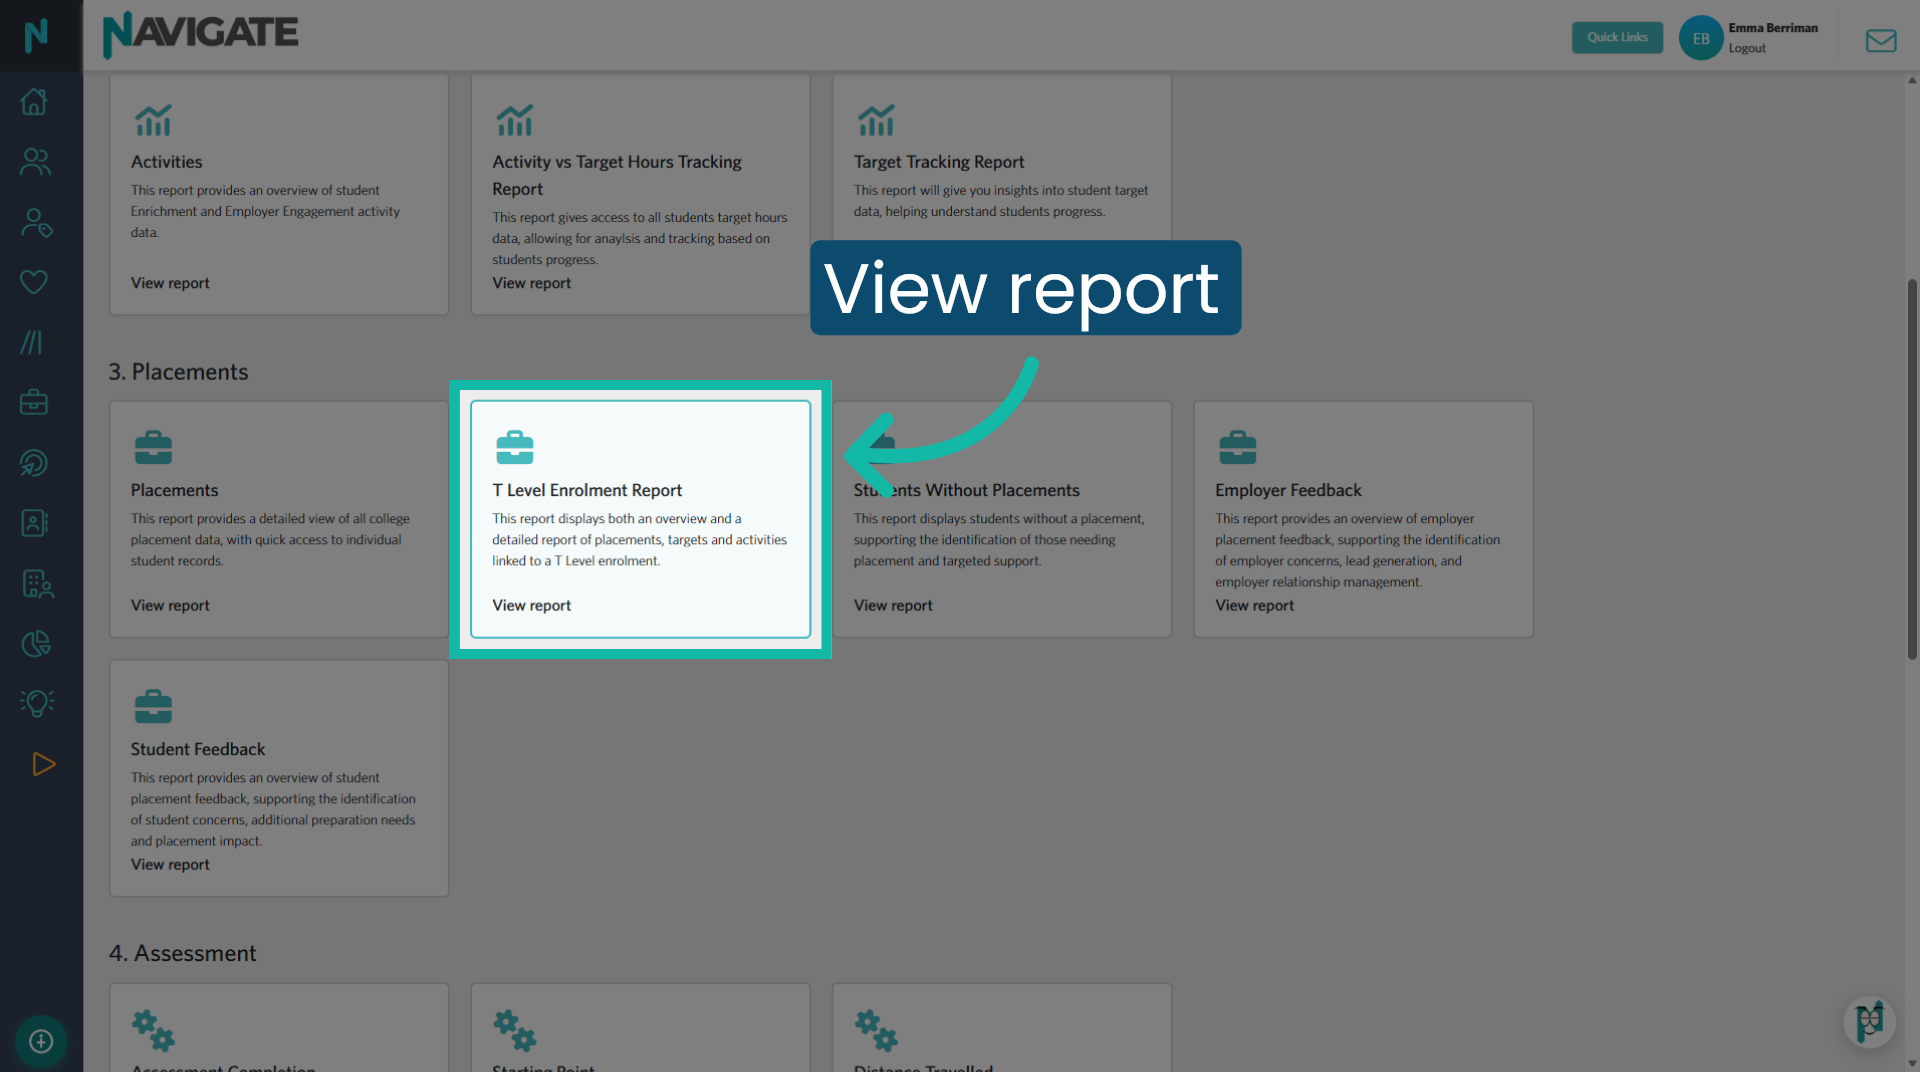
Open the T Level Enrolment Report to view all T Level enrolments, placements linked to an enrolment, and placements not yet linked to an enrolment.
3. Enrolment Start Date
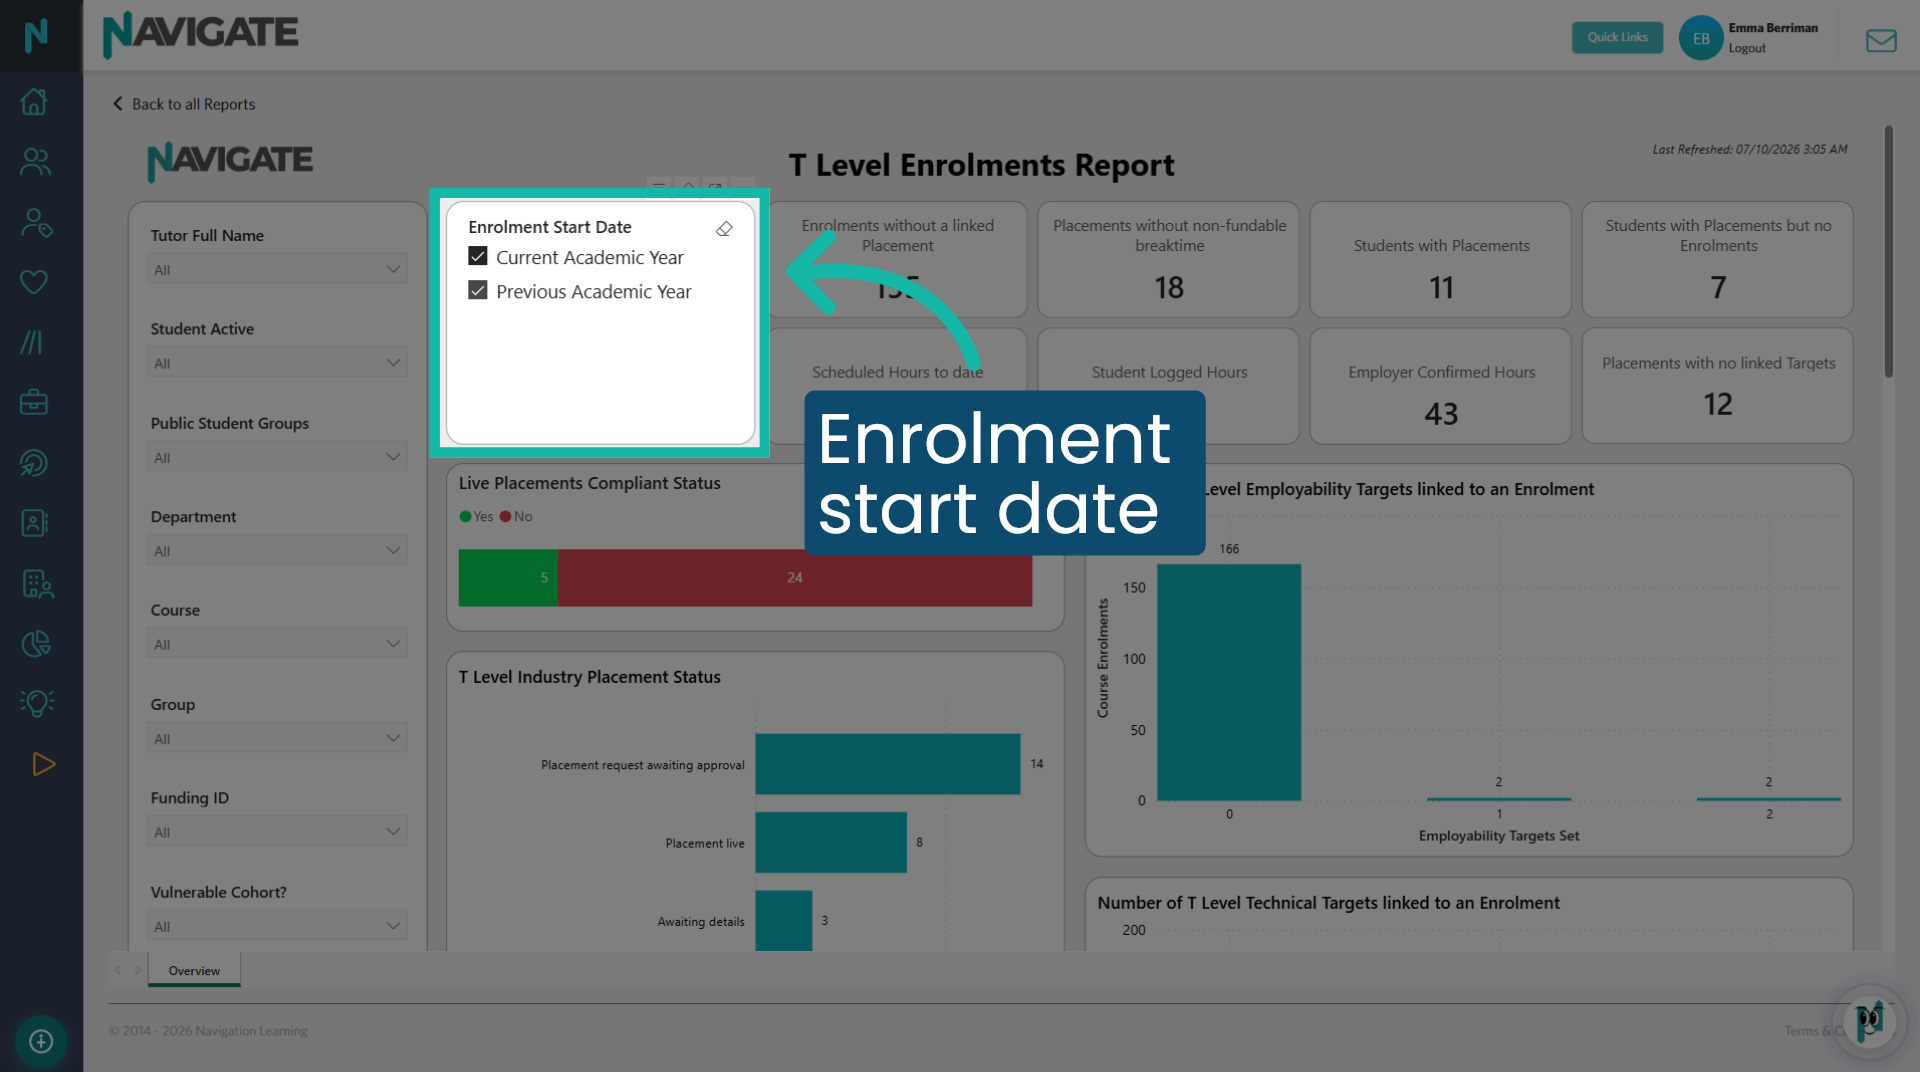
Select the enrolment start date for the data you wish to view. The current academic year applies to T Level first years, while the previous academic year pertains to your T Level second years. You can select both for all current T Levels.
4. Data tiles
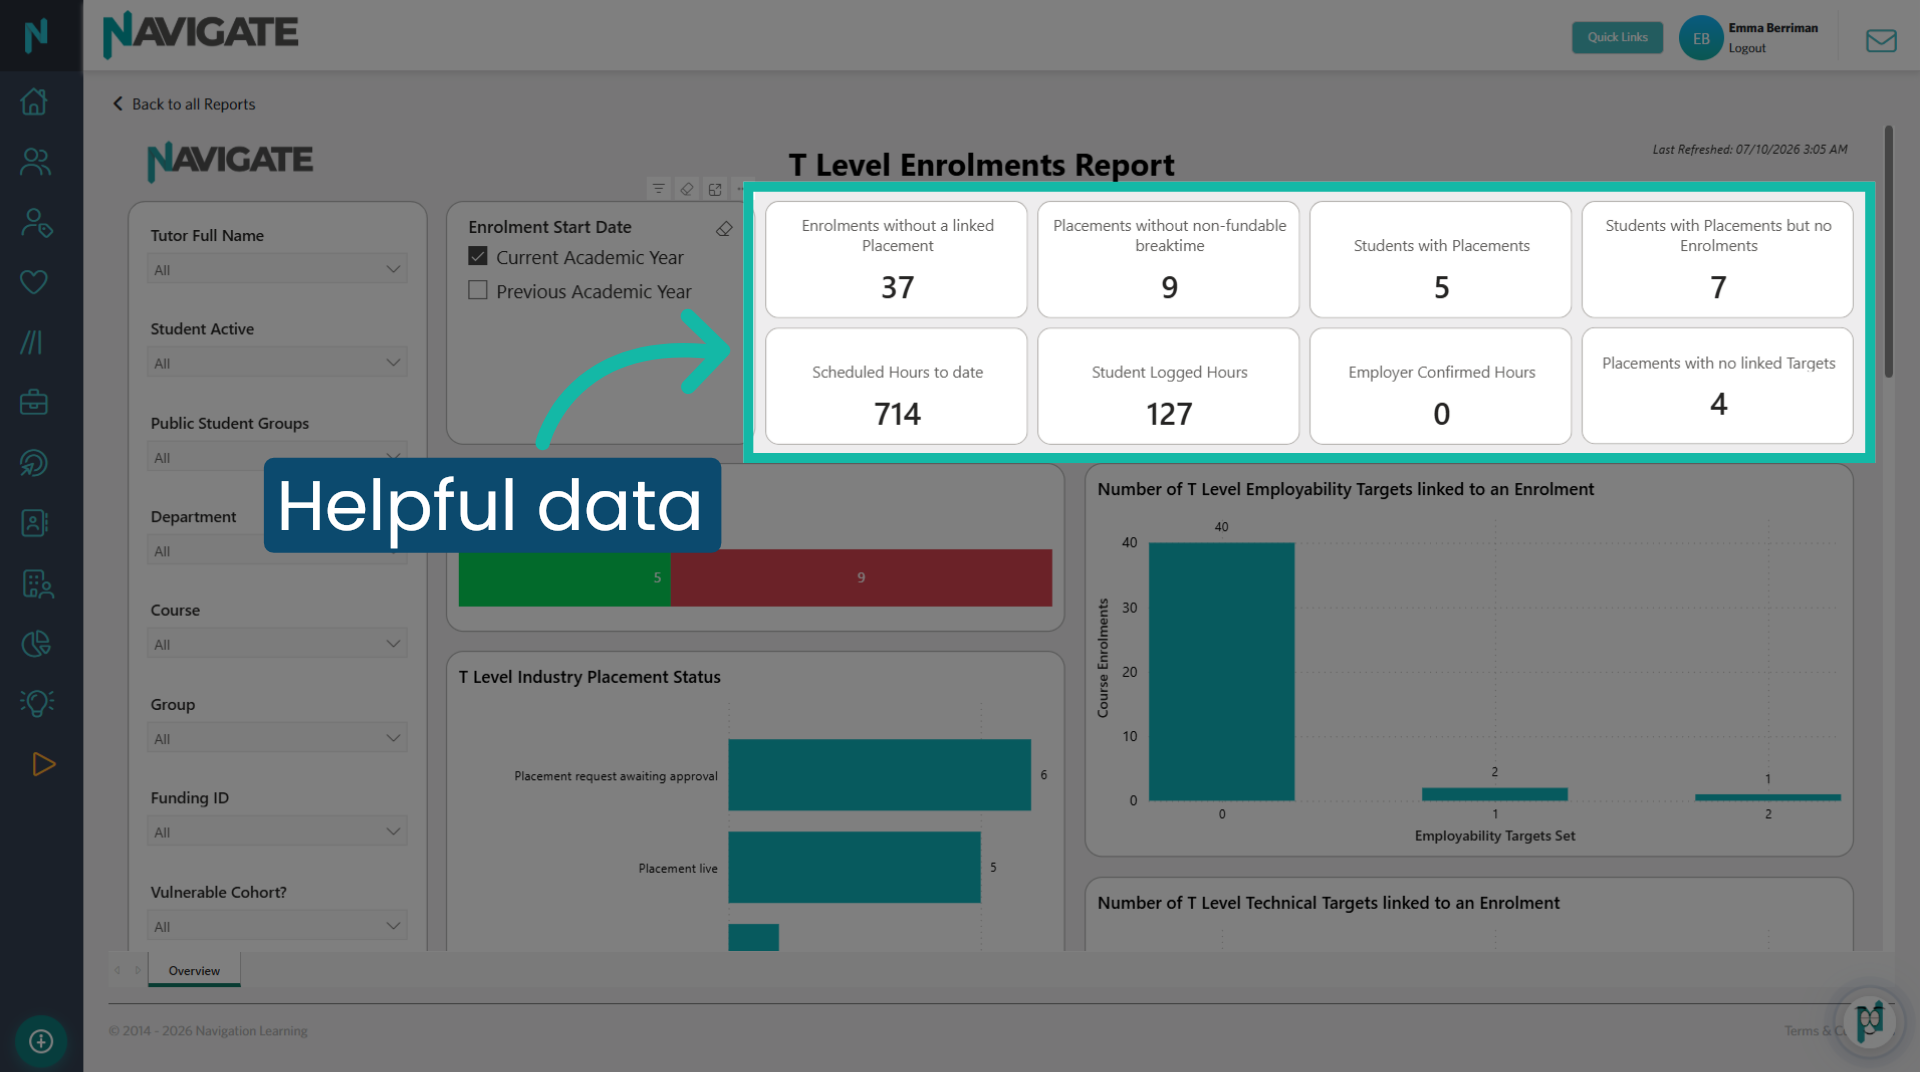
These tiles present snapshots of valuable data. They display students with placements, scheduled hours to date, and both student and employer confirmed hours. The remaining tiles indicate actions that may require your attention. For example, I have 9 placements that do not have a 'non-fundable break time' added. These placements can be identified in the T Level Placements grid.
5. Filter for inactive learners
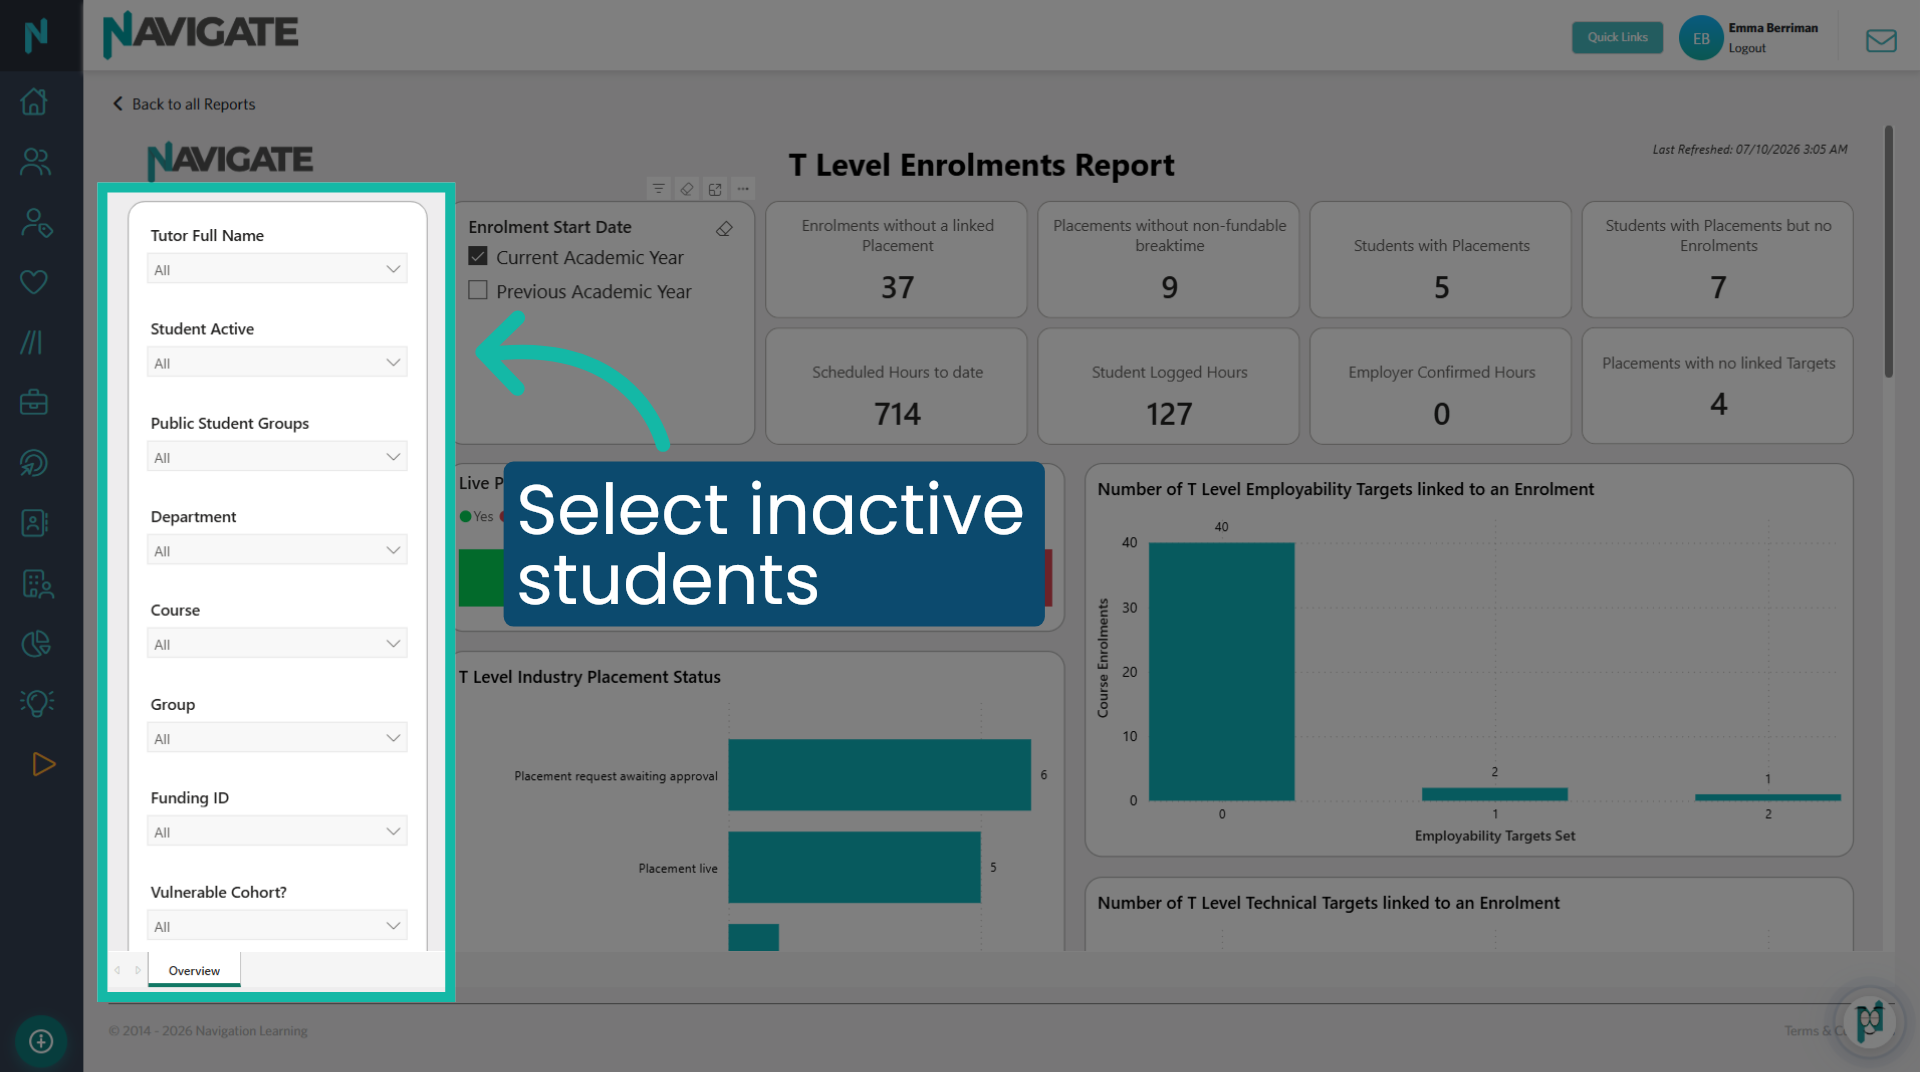
You may want to view data for students who are no longer active on Navigate. This report will only display data for students whose enrolment start date falls within the current or previous academic years. Set Student Active to False to access data for students who may have been withdrawn.
6. Filters
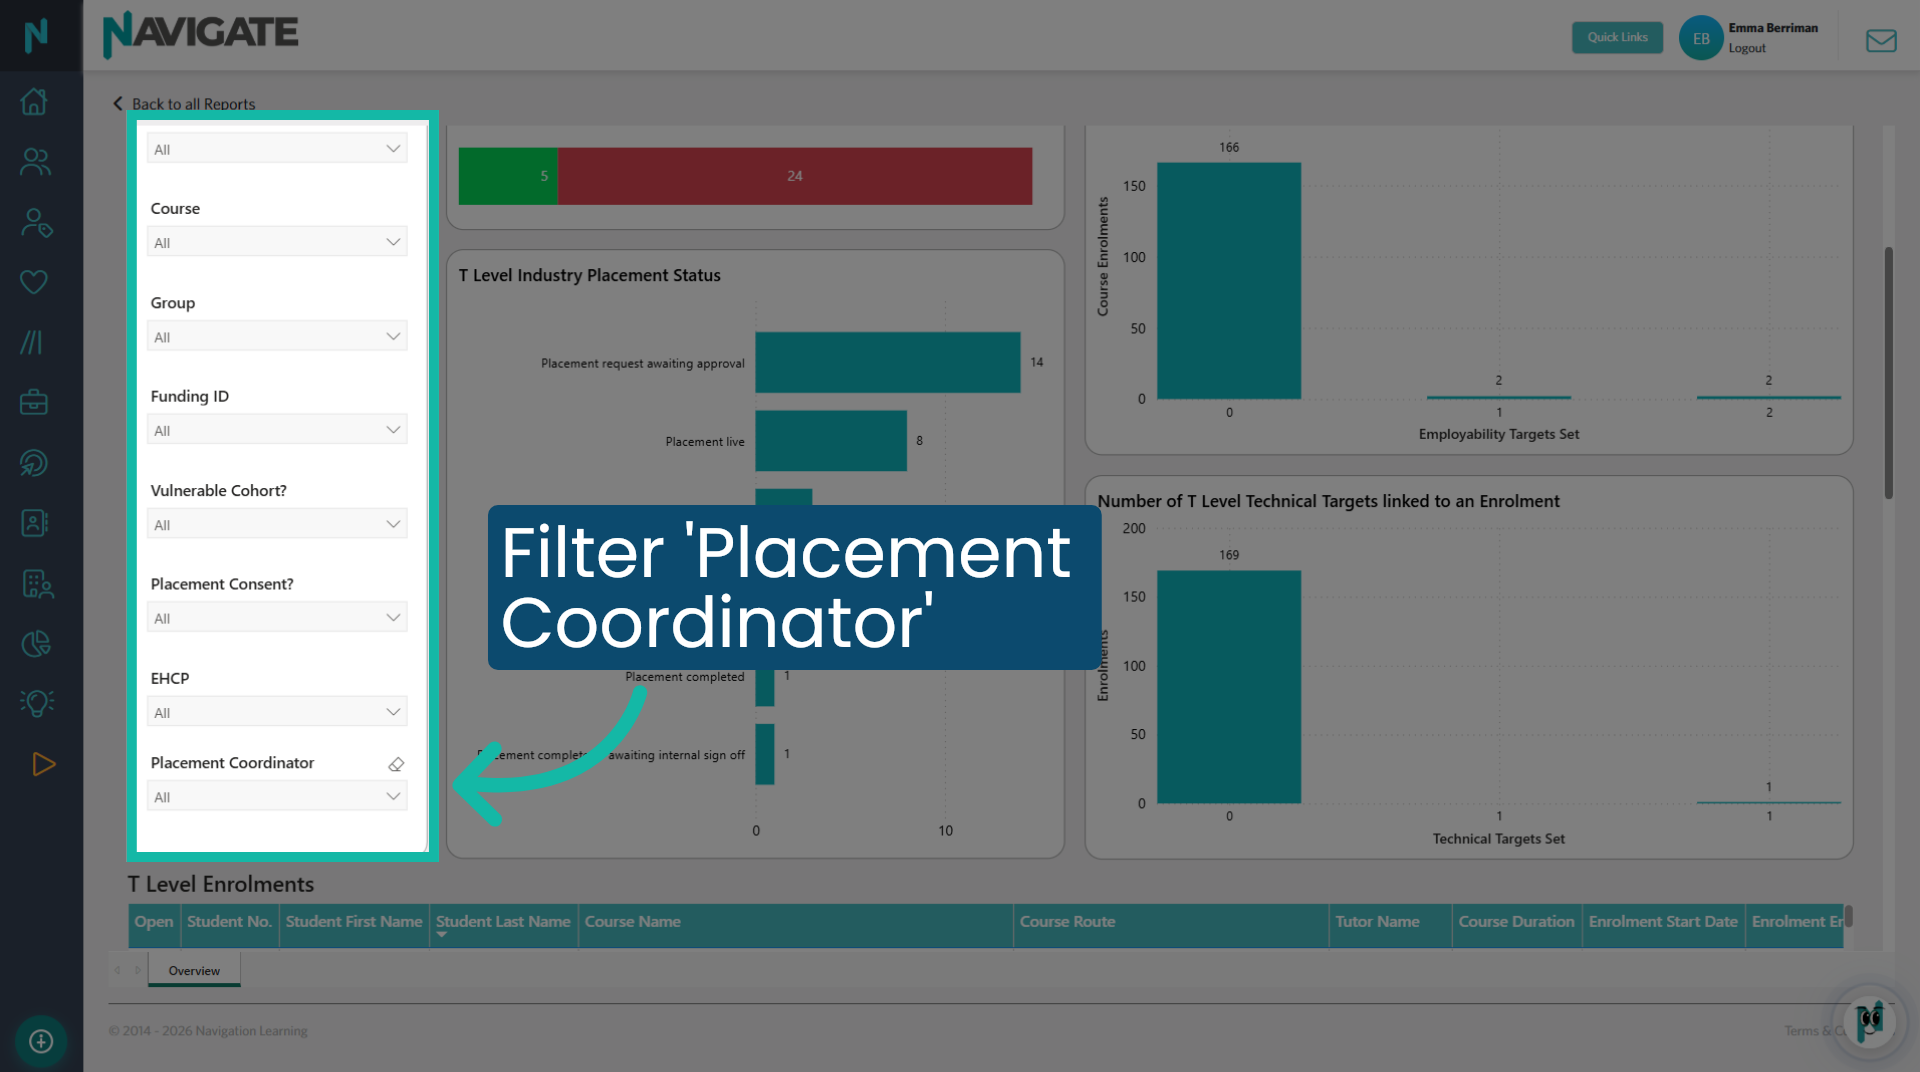
Use additional filters to enhance your data search. The 'placement coordinator' filter is useful when looking for a cohort that a specific placement coordinator oversees.
7. Data bars
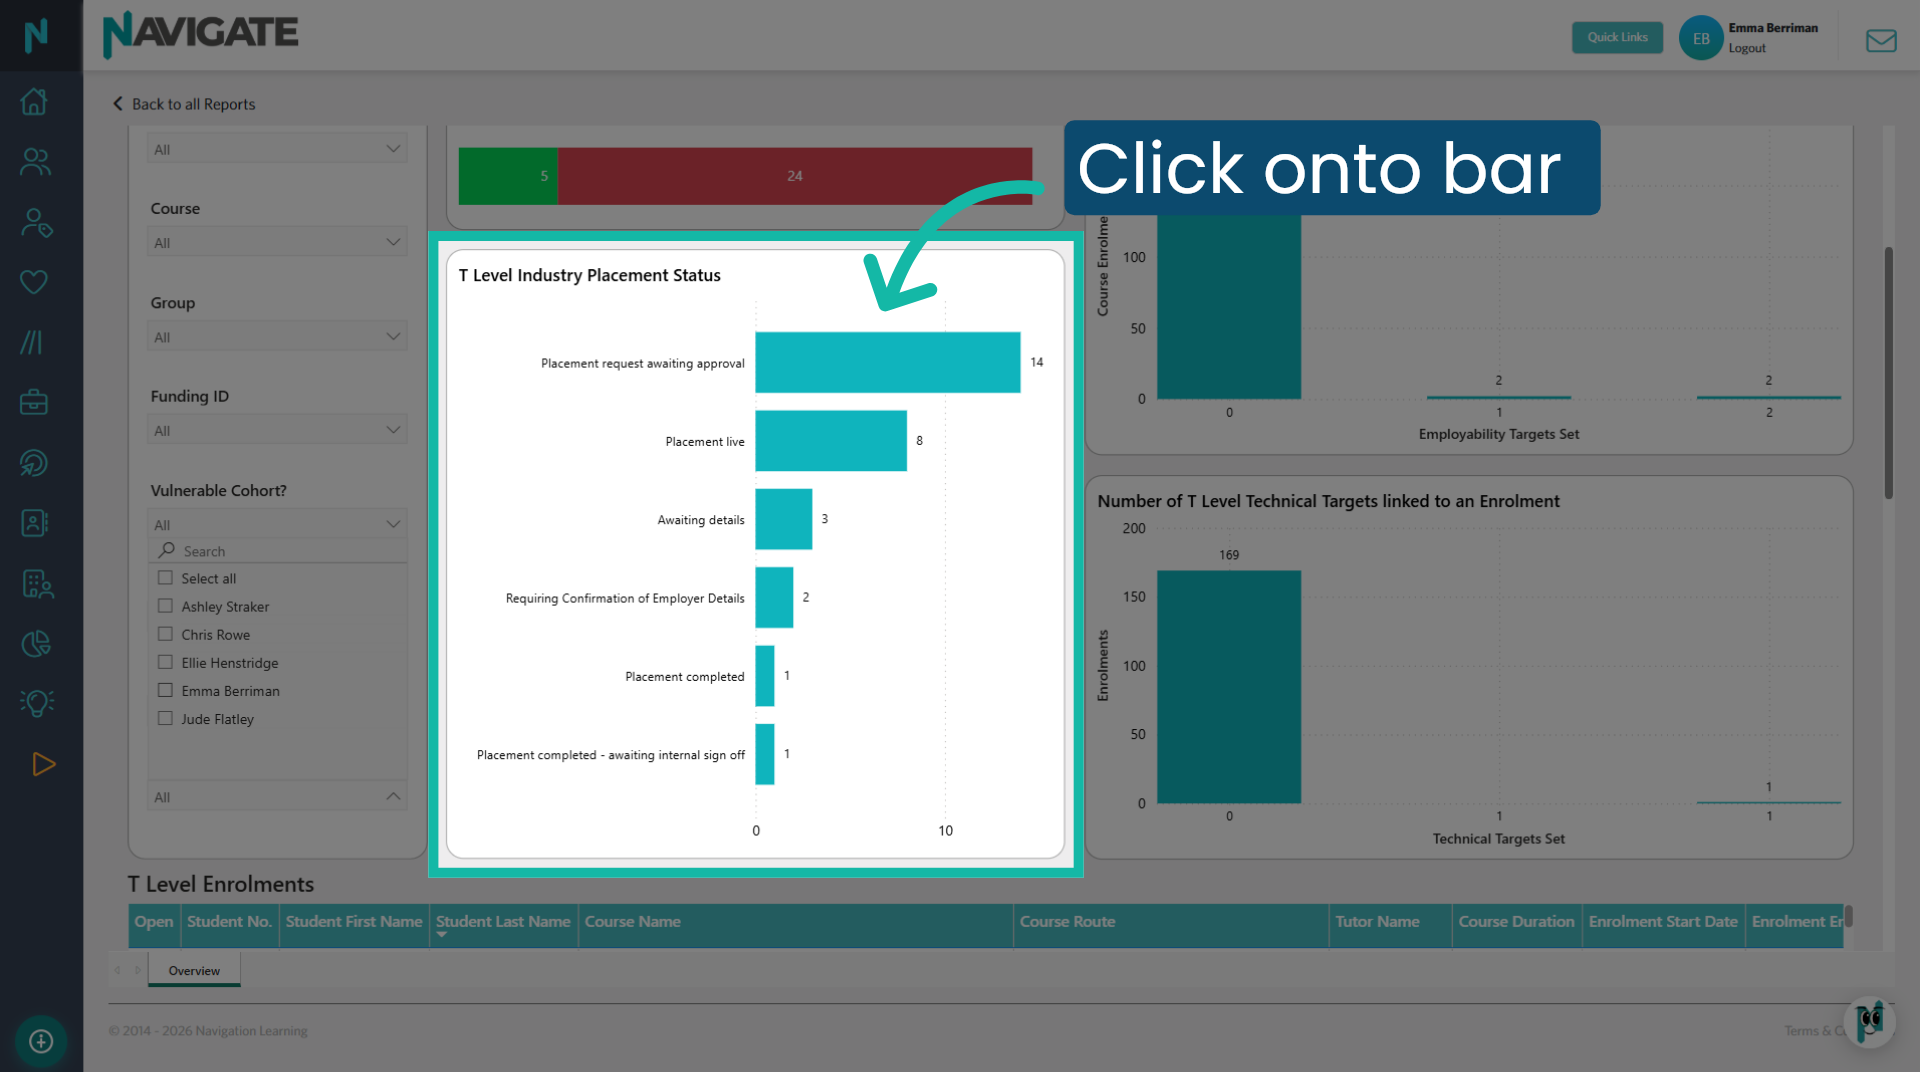
Click on the data bars to further filter data grids by compliance, placement status, or target data.
8. T Level enrolments grid
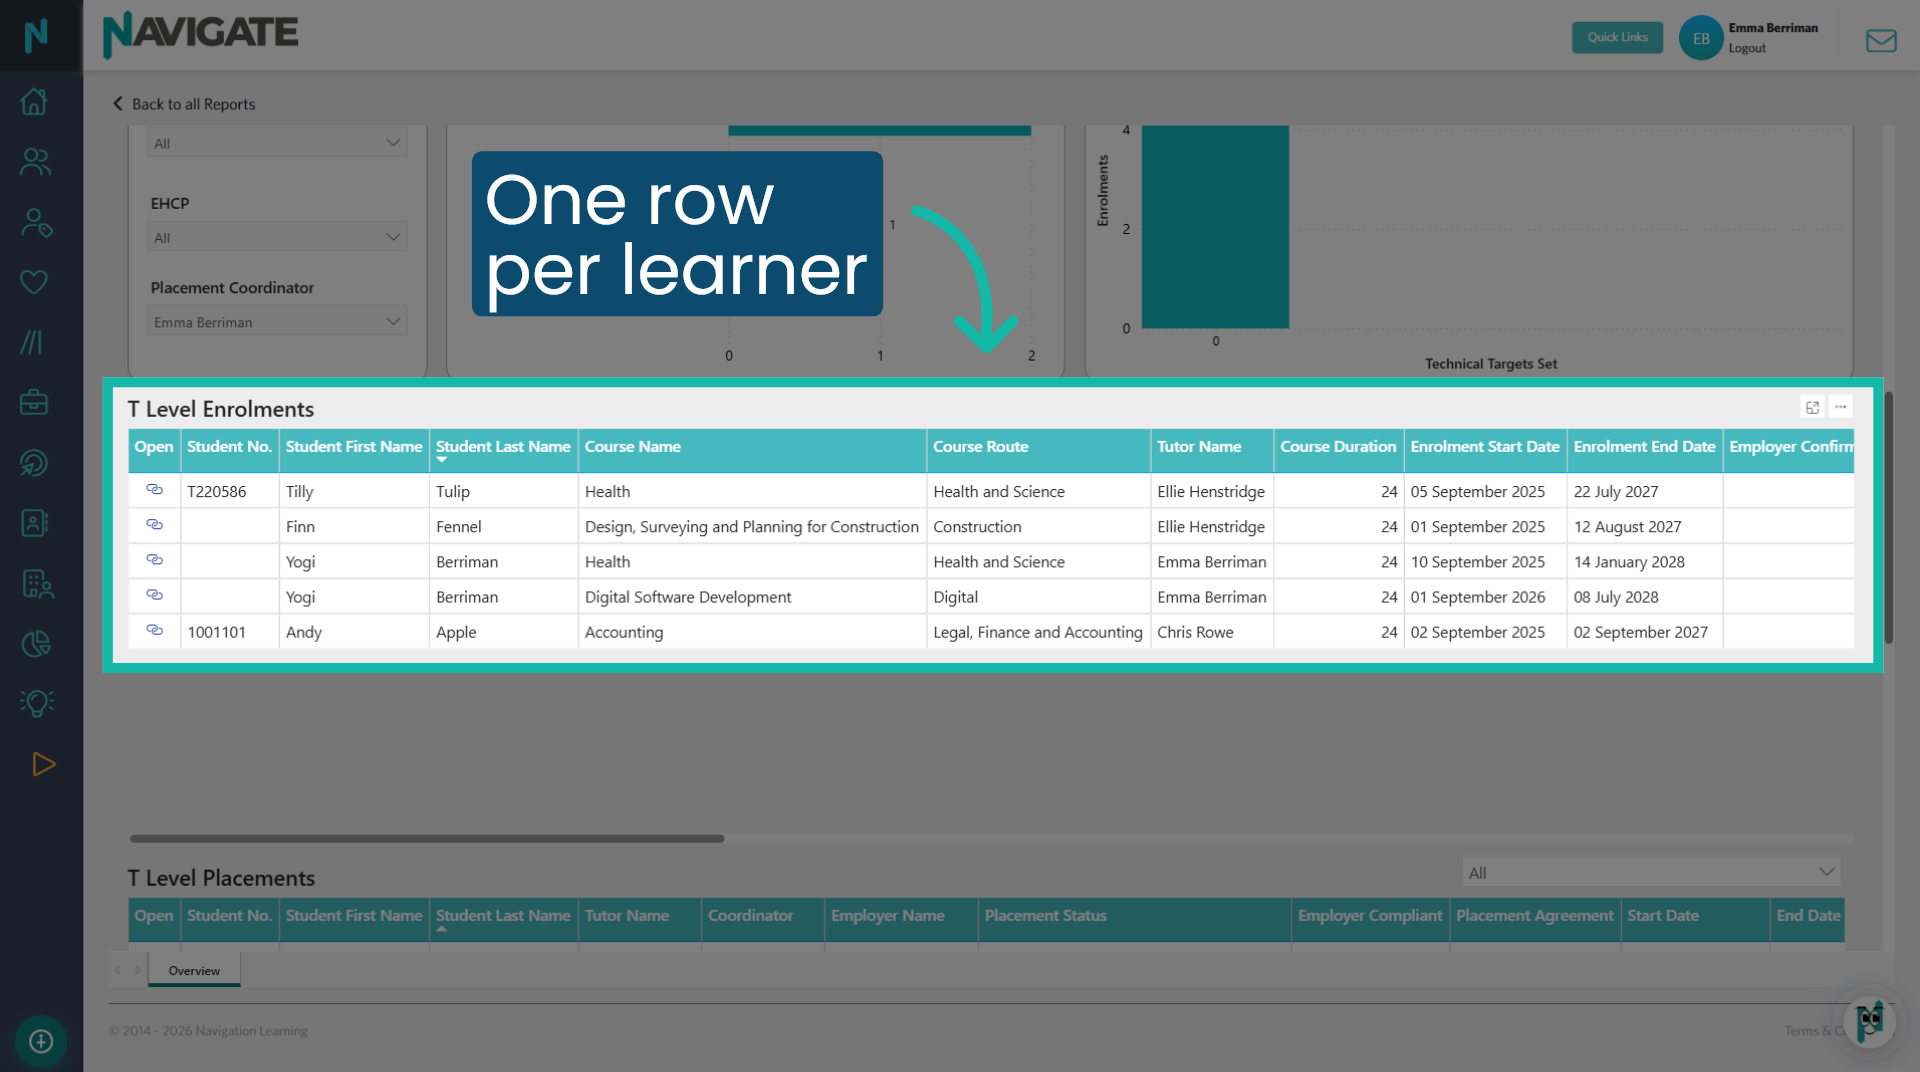
This grid presents a row for each Navigate T Level enrolment. All column headers are clickable, allowing you to filter the data alphabetically, by date, or in numerical order. The first column, labelled 'Open', provides access to the enrolment for editing purposes. Like all Navigate report grids, the data can be displayed or downloaded in various formats by selecting the three ellipses in the top right corner.
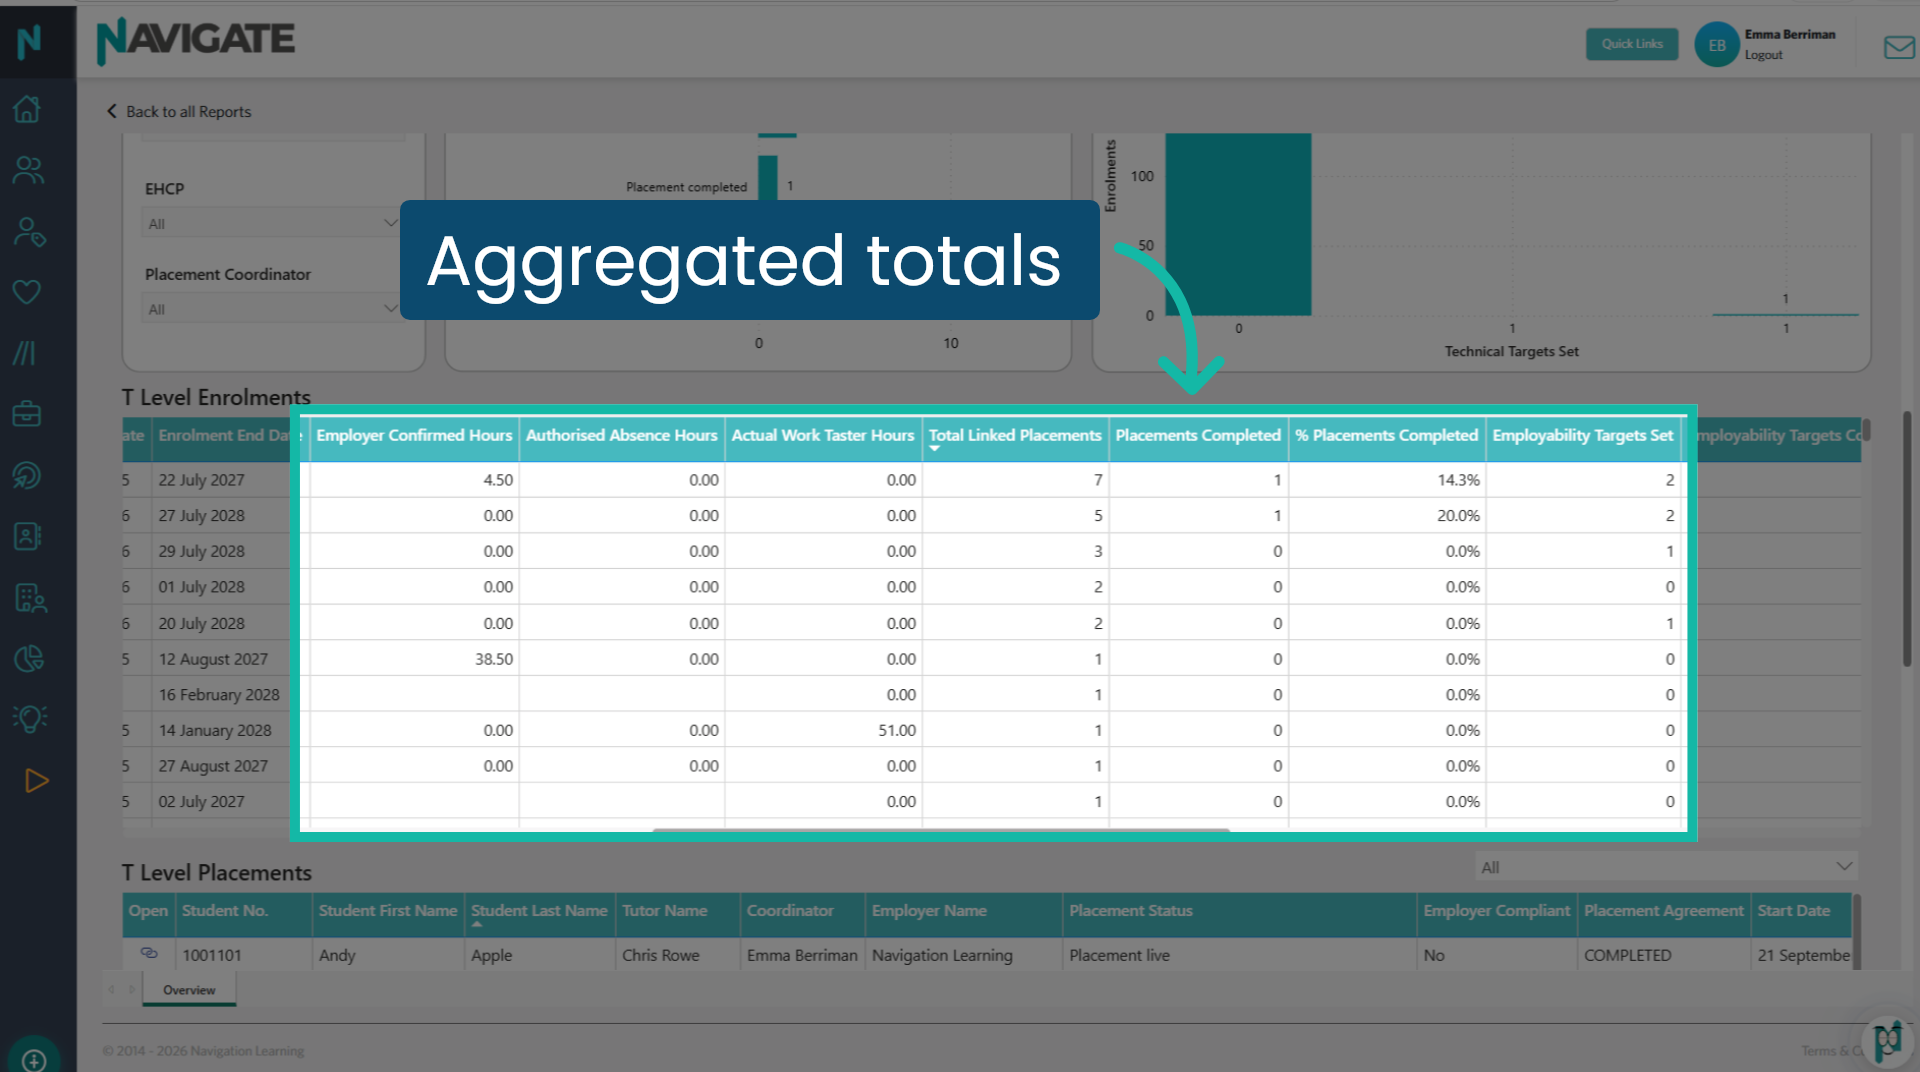
9. Aggregated data
When you link a T Level placement to an enrolment, it will track and display any auditable data in this grid. Linking a second T Level placement will aggregate the data, allowing you to view the total information for the enrolment. This enables you to see the total claimable data for one student, such as their progress towards reaching the 315 employer-confirmed hours or the number of 'Actual work taster activity hours' that have been logged.
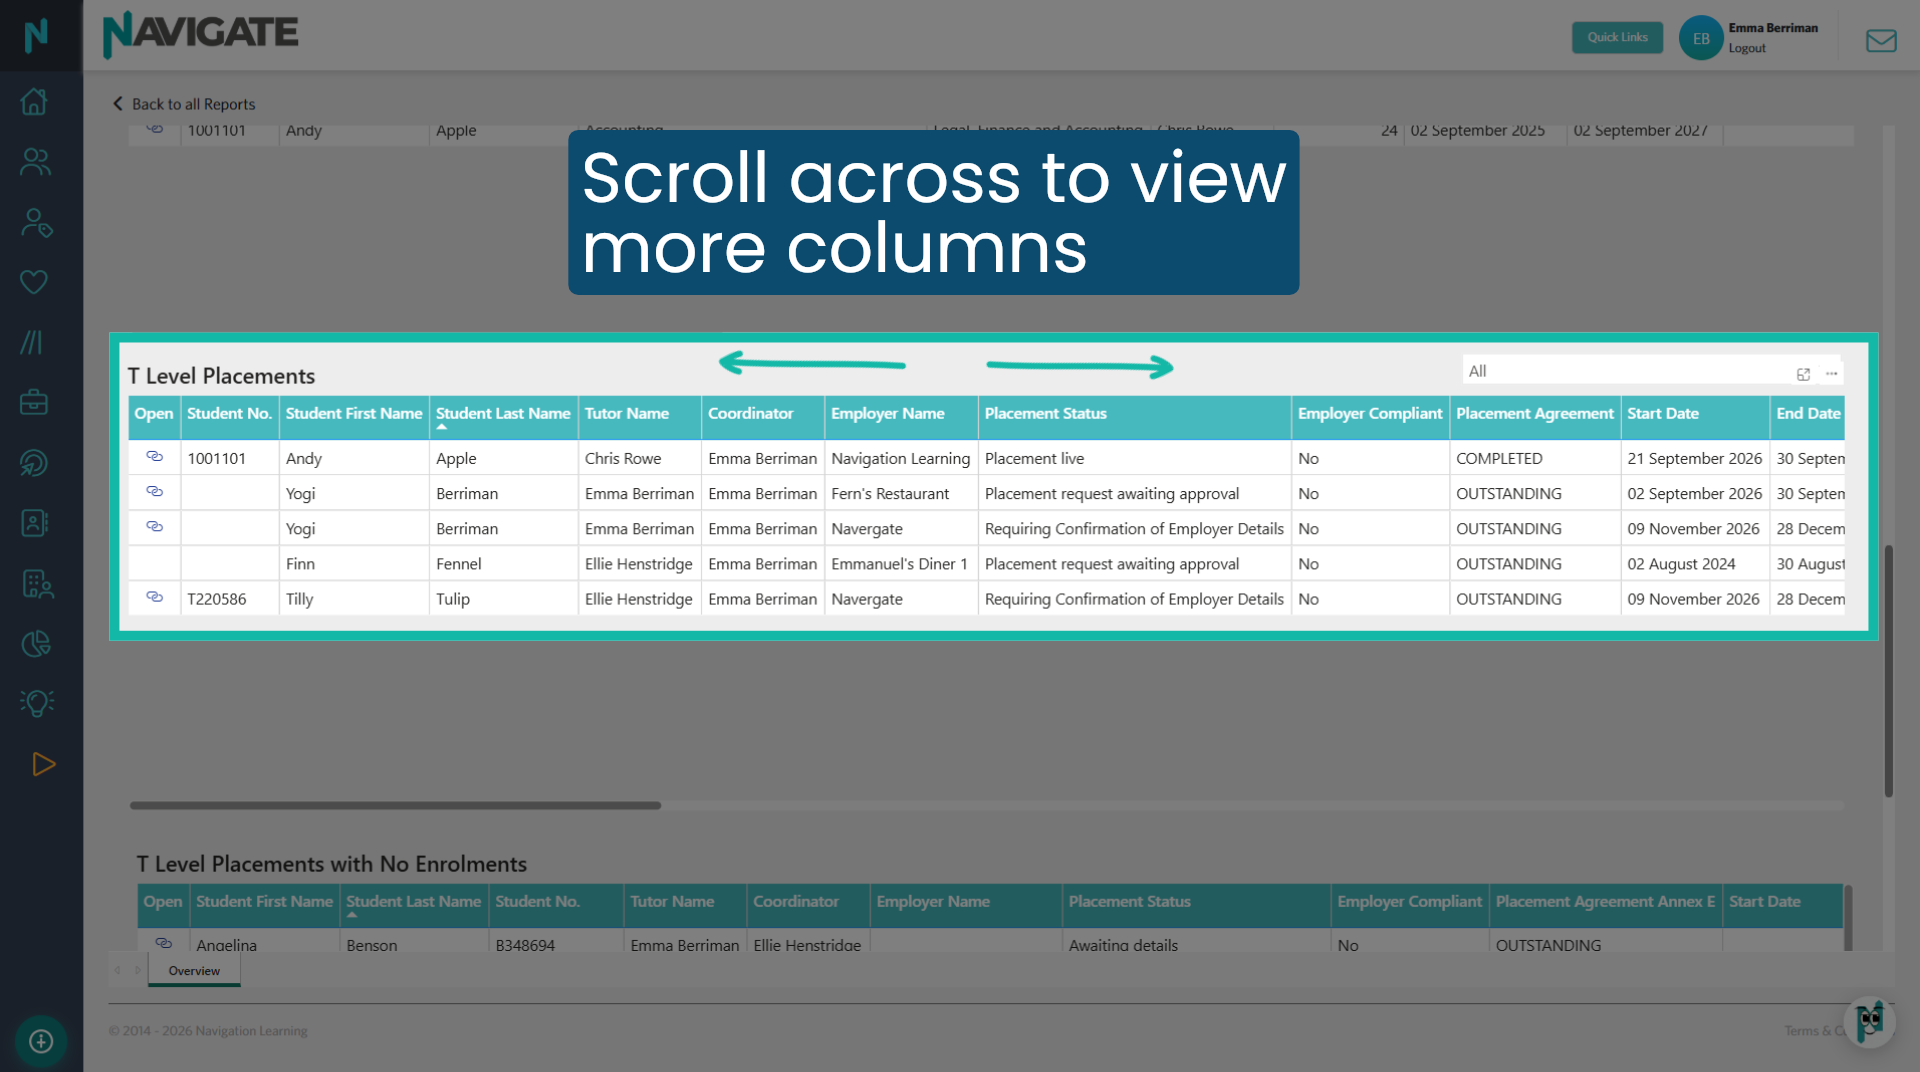
10. T Level Placements grid
This grid presents a row for each placement that is linked to an enrolment shown in the grid above. The first column, labelled 'Open', allows you to access the placement for editing purposes. Like all Navigate report grids, the data can be displayed or downloaded in various formats by selecting the three ellipses in the top right corner.
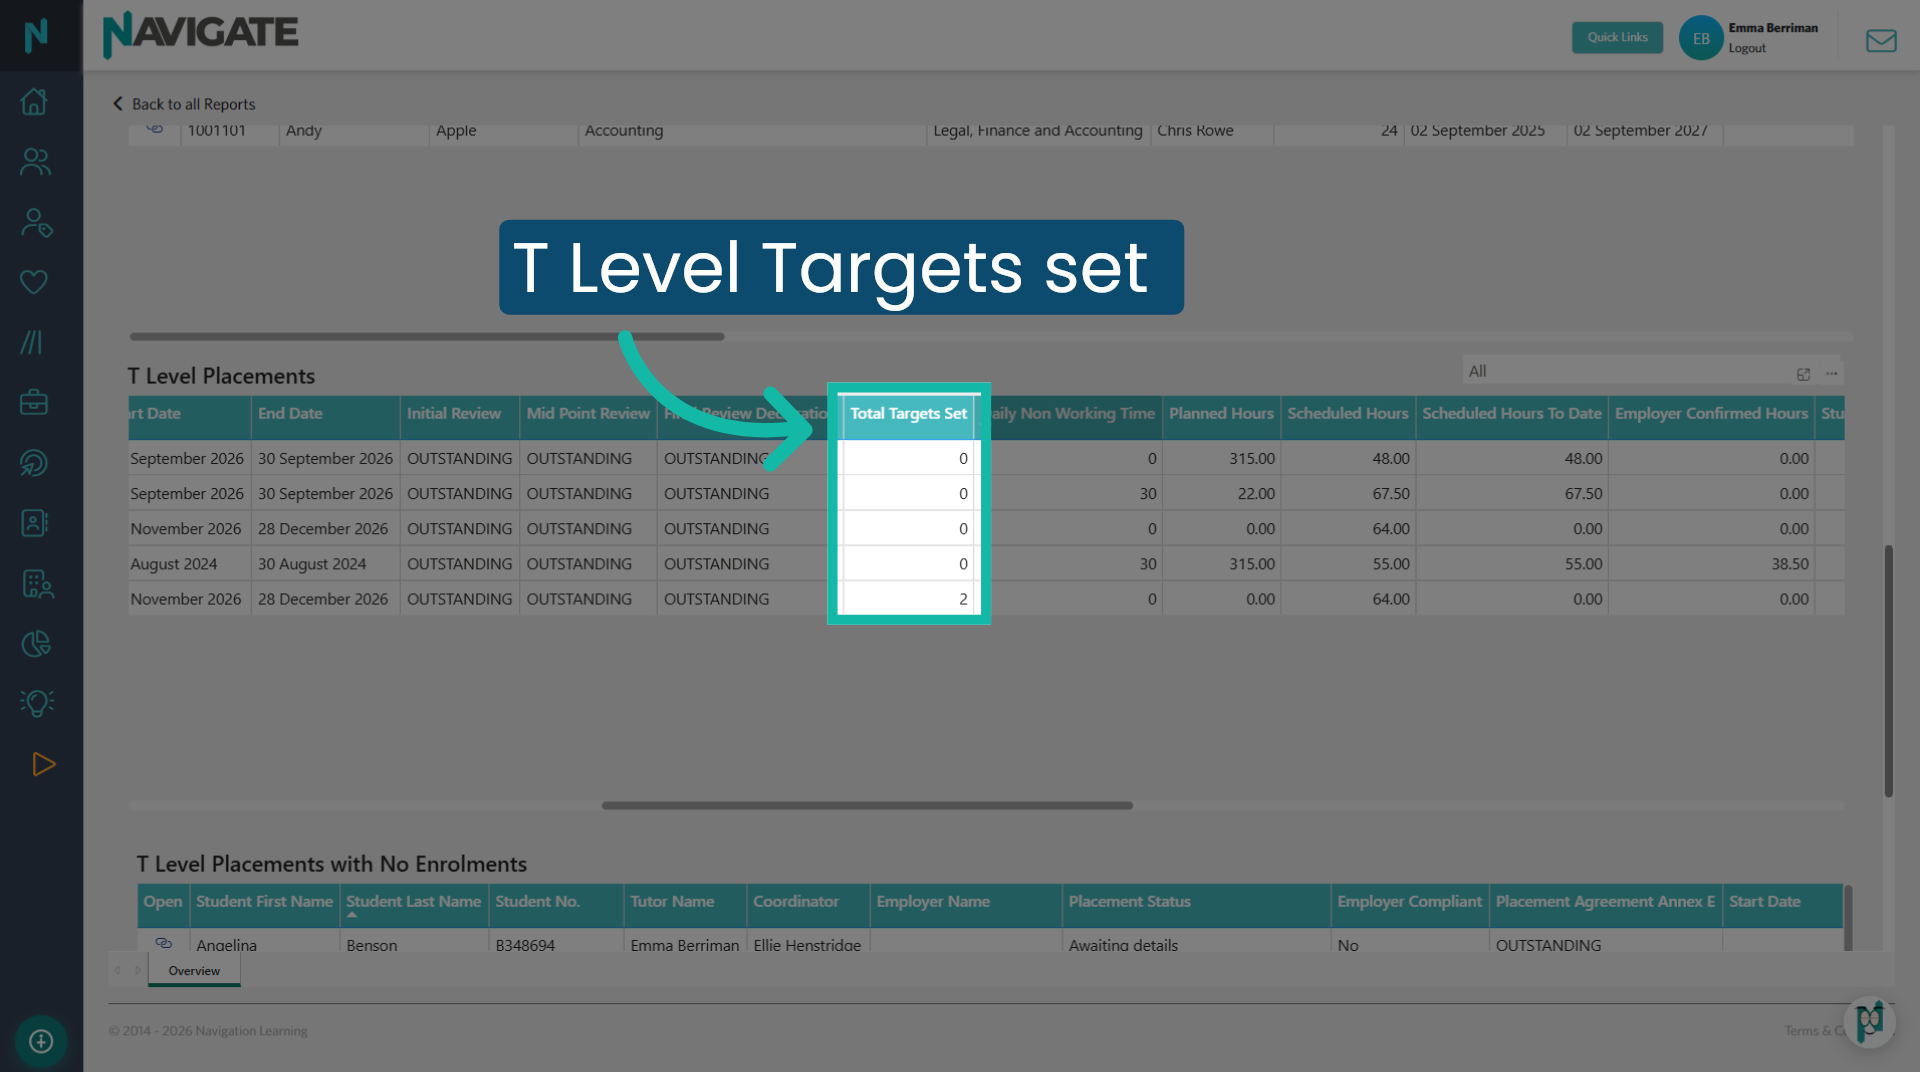
11. Total targets set
This column tracks the total number of T Level targets created and linked to a specific placement. Setting T Level Targets and linking them to the T Level placement allows students to tag individual placement days directly to their relevant learning goals. It also pulls linked targets through to the midpoint and final reviews, allowing staff and employers to evaluate and grade student progress during the review.
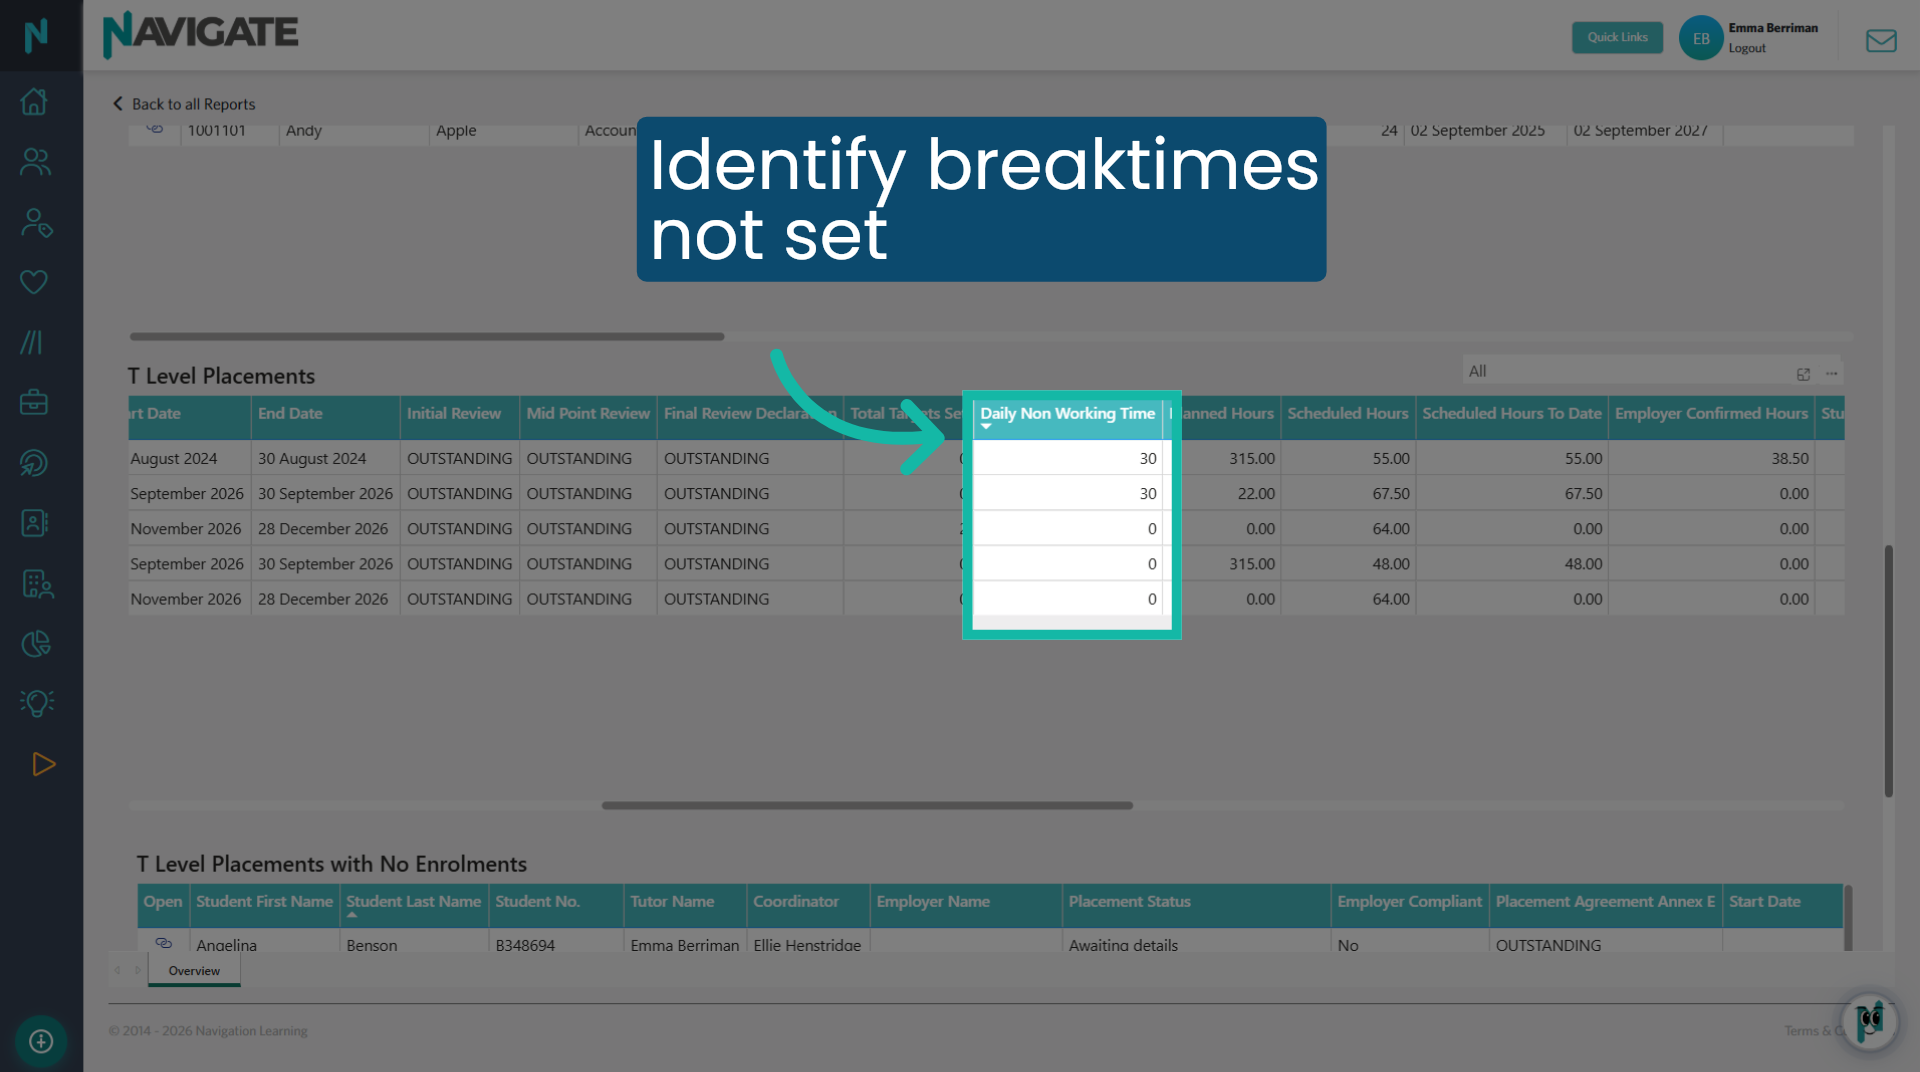
12. Daily Non Working Time
This column displays the 'Daily Non-Working Time', or break time, allocated to a placement, or shows as zero where it is missing. Young workers under 18 are entitled to a 30-minute rest break if they work more than four and a half hours. Break time is excluded from T Level placement hours. For shifts exceeding four and a half hours, Navigate automatically deducts this designated break time from both student and employer confirmed hours.
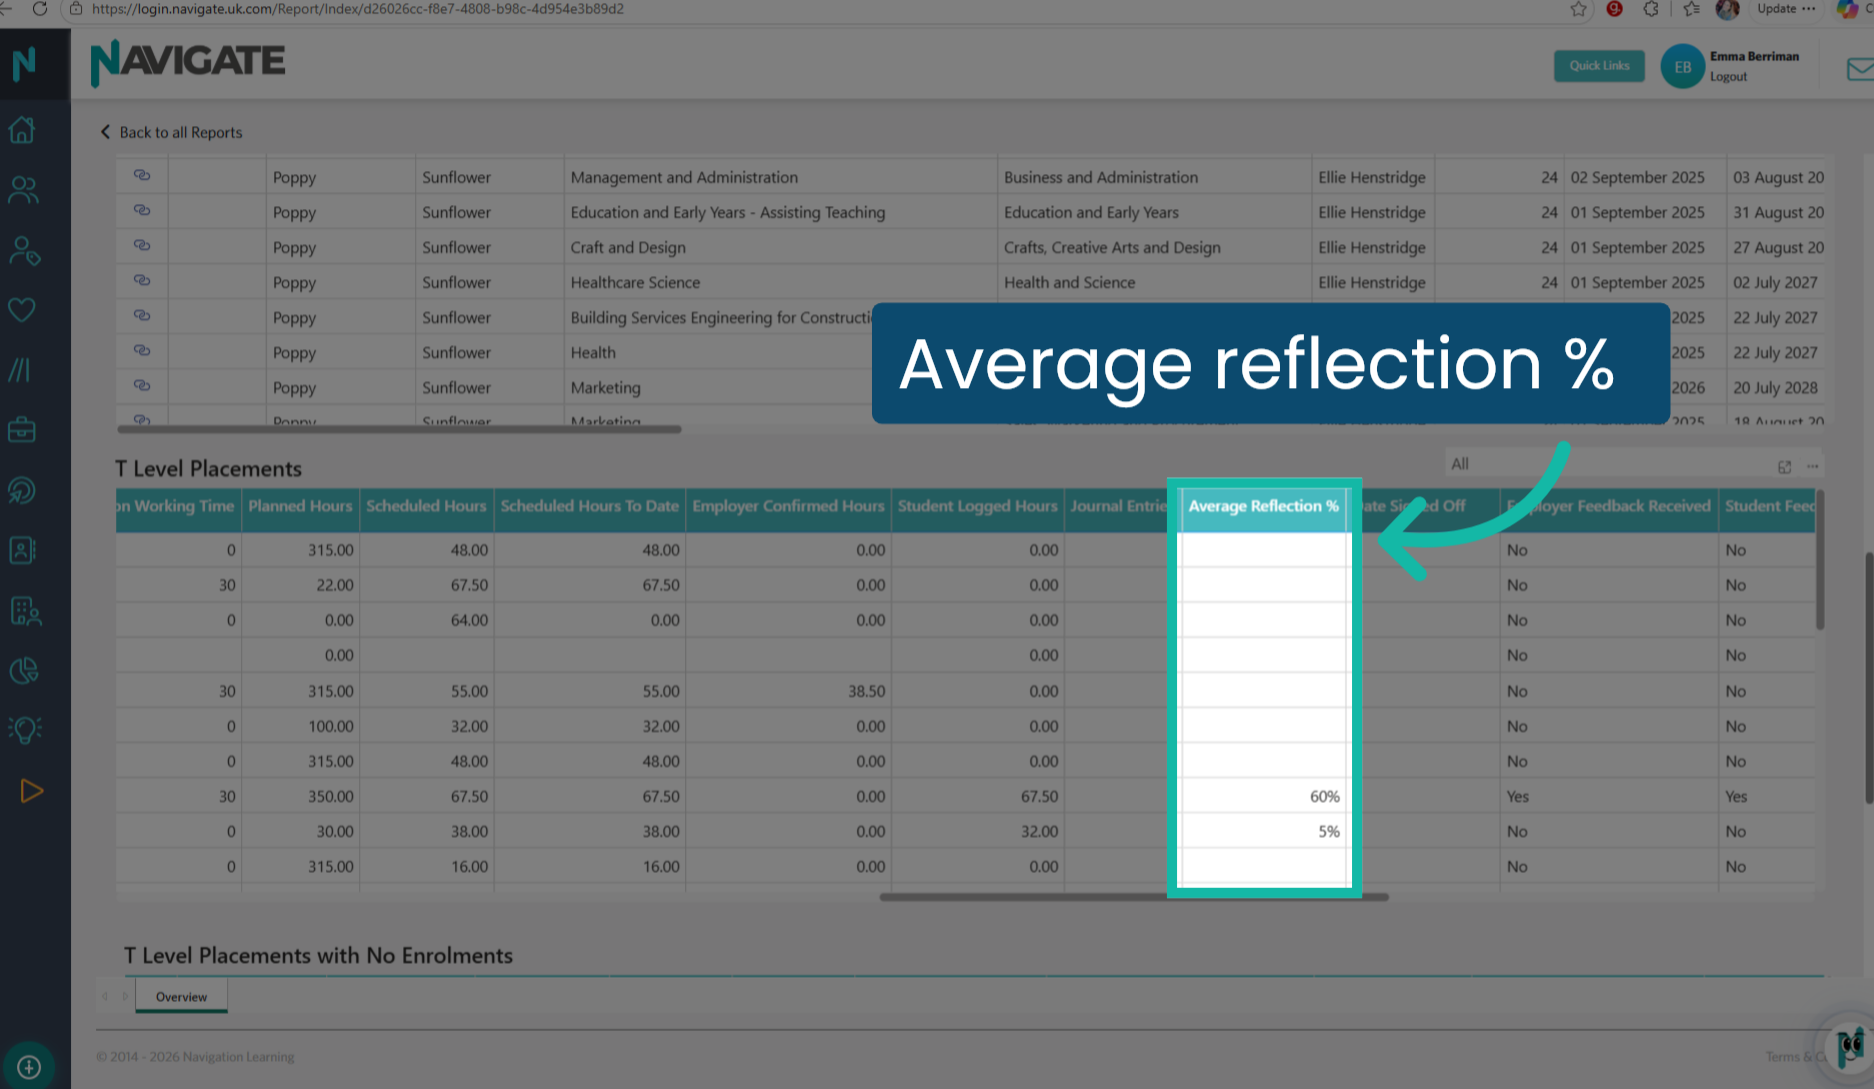
13. Average reflection %
This column displays the student's average reflection quality score across all journal entries for each Industry Placement. Driven by Navigate's AI Reflection Coach, this metric evaluates how thoroughly a student reflects on their placement day. A fully detailed reflection earns a score of 100%.
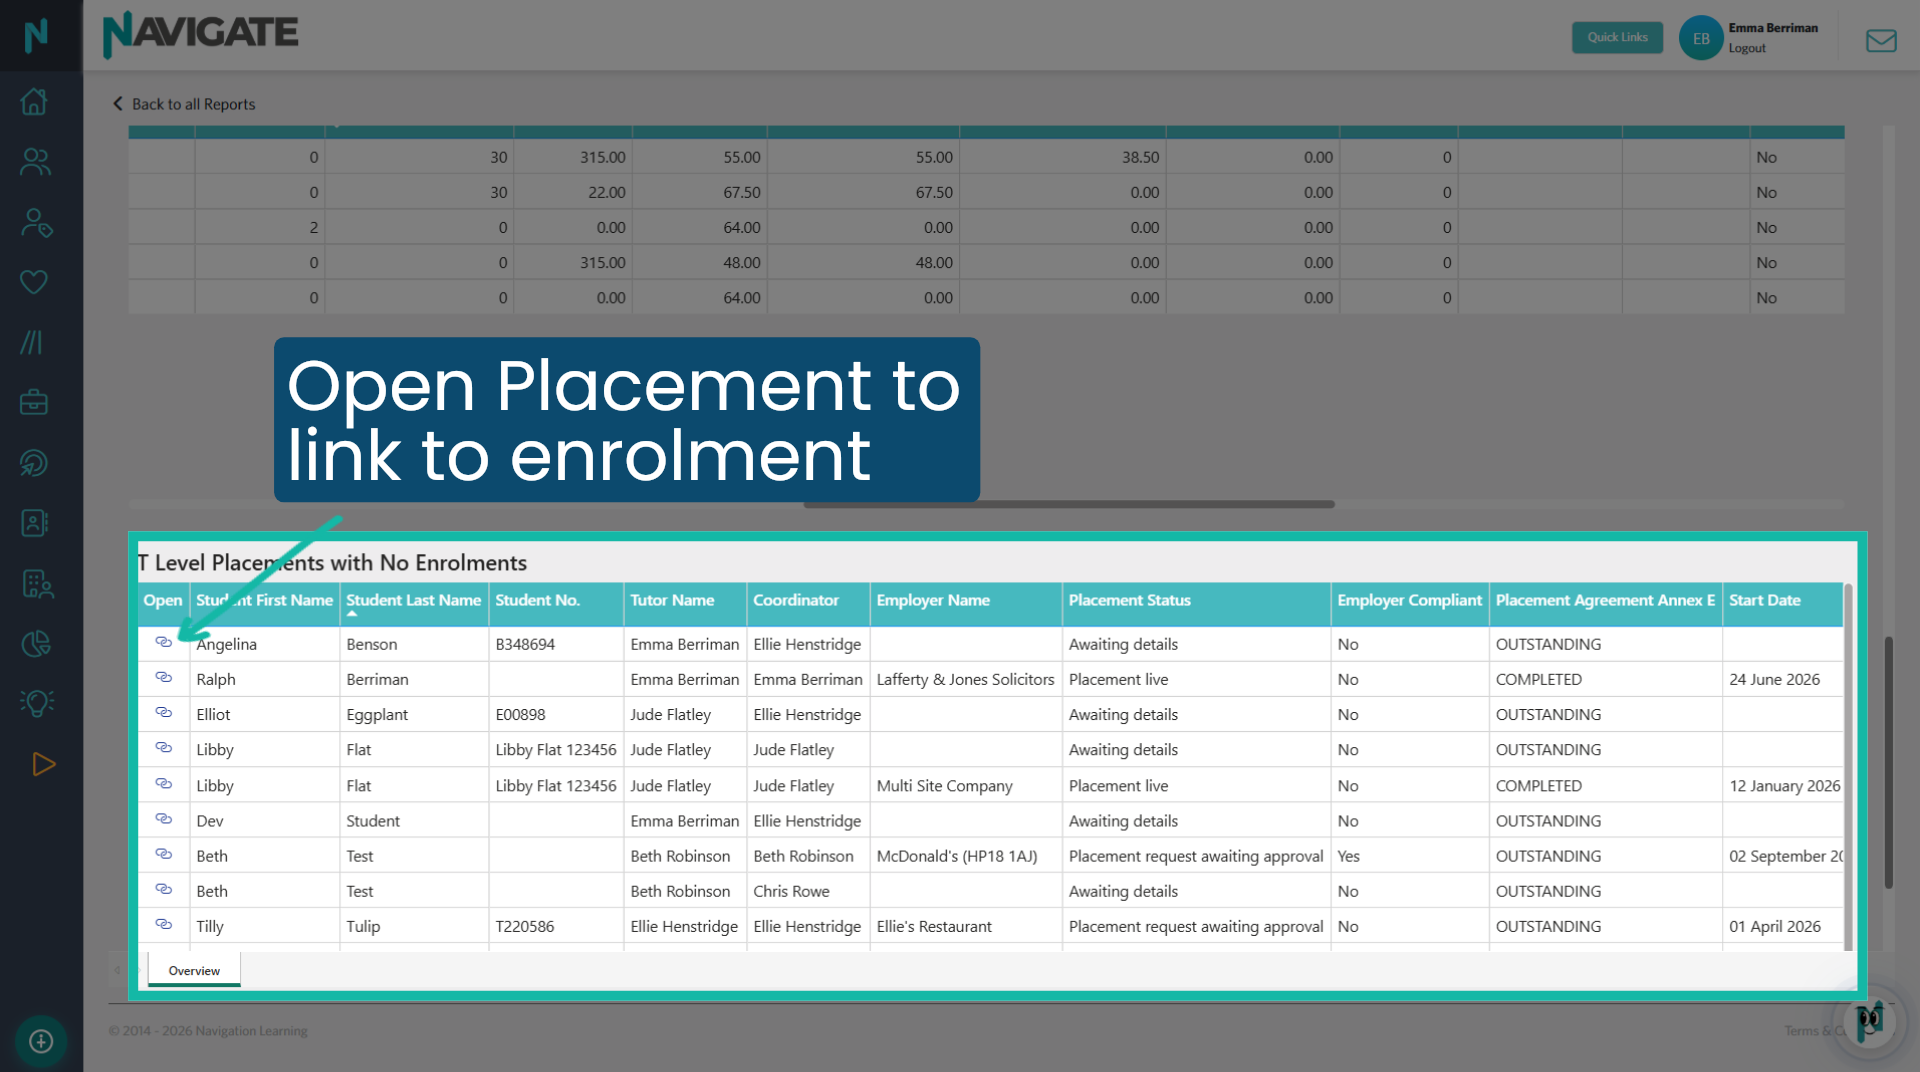
14. T Level Placements with no Enrolment grid
This grid displays all T Level Industry placements that have not been linked to an enrolment. Simply click the 'link' icon in the 'Open' column to open the placement record and select 'Link Enrolment' in the 'Placement details' tab. Once linked, this placement will move into the 'T Level Placements' grid above, and the data will be included in the 'T Level Enrolments' grid when the report updates overnight. Like all Navigate report grids, the data can be displayed or downloaded in various formats by selecting the three ellipses in the top right corner.
Was this article helpful?
That’s Great!
Thank you for your feedback
Sorry! We couldn't be helpful
Thank you for your feedback
Feedback sent
We appreciate your effort and will try to fix the article